Bridge Report: (4248) Takemoto Yohki
![]()
 Emiko Takemoto, President | Takemoto Yohki Co., Ltd. (4248) |
 |
Company Information
Exchange | First Section, TSE |
Industry | Chemical (Manufacturing) |
President | Emiko Takemoto |
HQ Address | 2-21-5 Matsugaya, Taito-ku, Tokyo |
Year-en | End of December |
Homepage |
Stock Information
Share Price | Shares Outstanding | Market Cap. | ROE (actual) | Trading Unit | |
¥1,564 | 12,528,400 shares | ¥19,594 million | 14.8% | 100 shares | |
DPS (Est.) | Dividend Yield (Est.) | EPS (Est.) | PER (Est.) | BPS (actual) | PBR (actual) |
¥19.00 | 1.2% | ¥93.91 | 16.7 x | ¥679.43 | 23 x |
* Stock price as of closing on March 4, 2018. Number of shares, ROE and BPS are actual results at the end of the previous term.
Earnings Trends
Fiscal Year | Sales | Operating Profit | Current Profit | Net Profit | EPS (¥) | Dividend (¥) |
FY12/12 | 9,654 | 632 | 658 | 434 | 42.39 | 2.00 |
FY12/13 | 10,017 | 757 | 813 | 592 | 57.78 | 2.50 |
FY12/14 | 11,062 | 877 | 879 | 581 | 56.48 | 9.50 |
FY12/15 | 12,221 | 1,250 | 1,275 | 827 | 72.82 | 14.00 |
FY12/16 | 12,799 | 1,259 | 1,279 | 836 | 73.65 | 15.00 |
FY12/17 | 14,201 | 1,412 | 1,440 | 986 | 82.29 | 17.00 |
FY 12/18 | 16,022 | 1,630 | 1,762 | 1,211 | 96.72 | 18.50 |
FY 12/19 Est. | 16,934 | 1,678 | 1,706 | 1,176 | 93.91 | 19.00 |
*Unit: Million Yen
*Estimates are those of the company. A 10 for 1 stock split on September 14, 2014, and a 2 for 1 stock split on January 1st, 2019 were performed. EPS and dividends have been retroactively adjusted to reflect these splits.
The definition for net income is net income attributable to parent company shareholders.
We present this Bridge Report by reviewing the fiscal year December 2018 business performance and medium term business plan (2019~2021) of Takemoto Yohki Co., Ltd.
Table of Contents
1.Company Overview
2.Fiscal Year December 2018 - Earnings Results Overview
3.Fiscal Year December 2019 - Earnings Estimates
4.Medium/Long-Term Plan (2019-2021)
5.Conclusions
<Reference: Regarding Corporate Governance>
Key Points
- The sales for the fiscal year December 2018 were ¥16,022 million, up 12.8% year on year. Takemoto satisfied the demand for standard bottles and custom bottles both in Japan and overseas. Operating profit was ¥1,630 million, up 15.5% year on year. SG&A expenses augmented 10.3% due to greater depreciation costs and a rise in personnel expenses accompanying increases in production, but was offset by the growth in sales. Both sales and profits exceeded initial and revised estimates.
- For the fiscal year December 2019, sales are forecasted to rise 5.7% year on year to ¥16.9 billion. Due to increasingly diverse consumer needs and shorter product cycles, the demand for standard bottles continues to grow, and Takemoto must continue working to reduce the time and money required for development. The company will actively create proposals for development, and new molds will be made. Improvements will be made to the existing Okayama Plant, and the Yuki Plant will be expanded, increasing production capacity. Operating profit is estimated to rise 3.0% year on year to ¥1,678 million. Depreciation expenses are expected to rise ¥177 million, due to the development of new molds, which measures the increase in production, and investment into labor-saving equipment. Raw material expenses will grow due to increased production and rising raw material prices, but the company will strive to curb SG&A expenses and raise profits. Both the interim and term-end dividends are to be ¥9.50/share. Taking the stock split into account, this is an increase of ¥0.5 /share from the previous term. The estimated payout ratio is 20.2%. The company aims to achieve a payout ratio of 20% or higher.
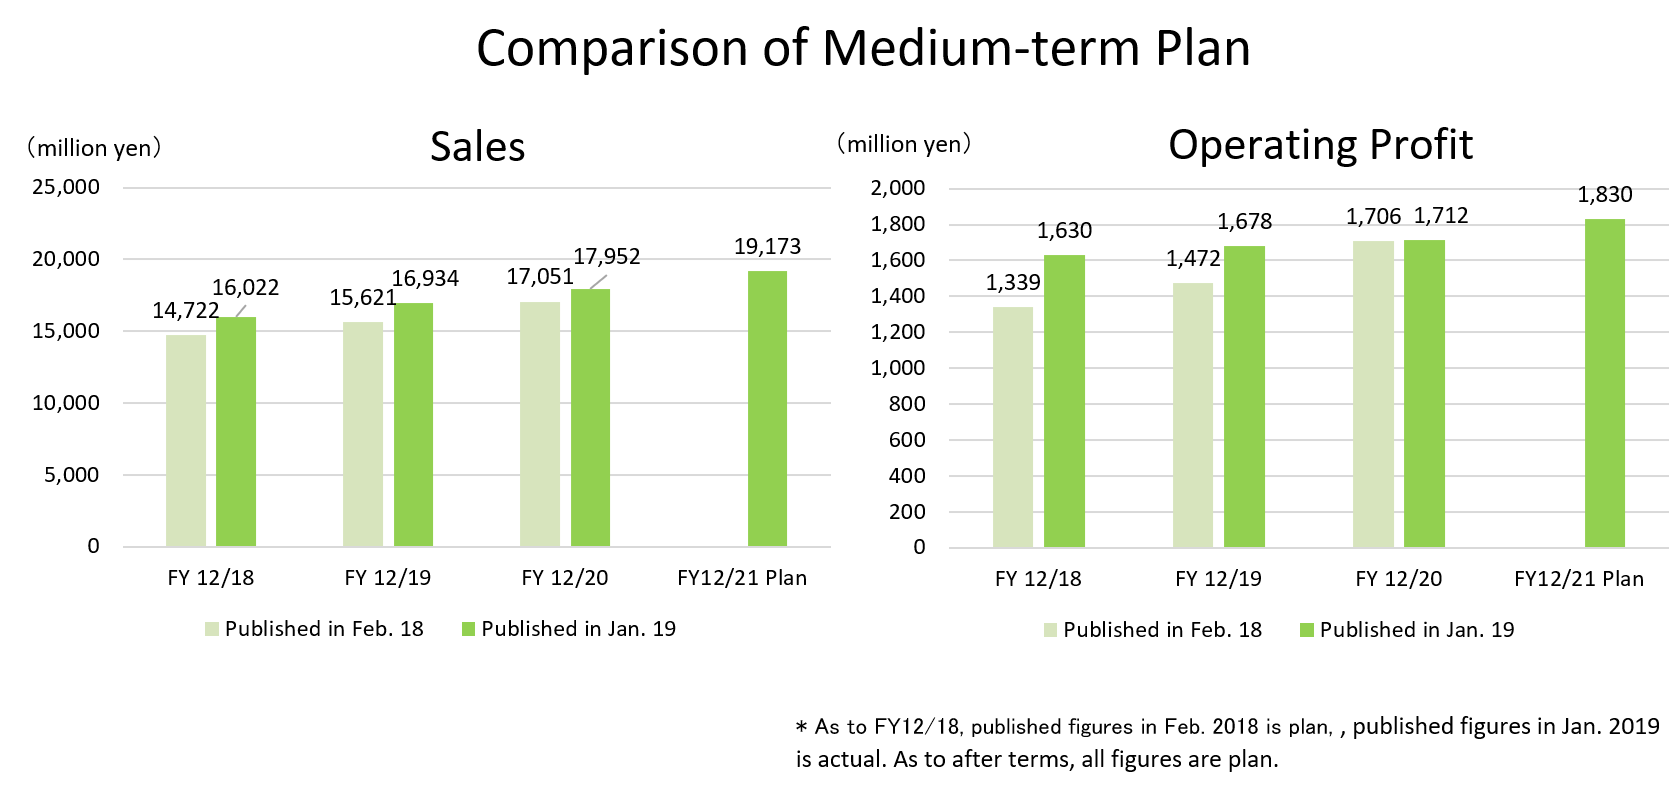
- A three-year medium-term plan was announced, beginning with the current term. Key points of this plan are sustainability (efforts to preserve the environment), a quick and agile business structure, and synergy between data and physical operations, with the goal of building a flexible company that is capable of responding to change. Takemoto aims to achieve sales of ¥19.1 billion and an operating profit of ¥1.8 billion in the fiscal year December 2021 by expanding global sales, development, and production activities, while increasing their production capacity to meet growing demands.
- Although the price of raw materials rose, and depreciation and personnel expenses increased in the fiscal year December 2018, both sales and profits grew by double-digits, surpassing estimates. The rate of increase in sales and profit is expected to remain in the single digits in this term, but the figures announced in Jan. 2019 for the medium-term plan are higher than the figures that were announced in Feb. 2018, so we anticipate steady growth for the time being. In addition to strong business performance in Japan, we are interested in the significant sales growth seen in China, India, and the Netherlands. While focusing on current business performance, we look forward to what the “creation of new business” mentioned in the mid-term plan will entail.
1.Company Overview
Takemoto Yohki Co., Ltd. plans and designs “standard bottles.” A “Standard Bottle” is a term to refer to a packaging container when it is planned and designed in-house and, at the same time, when the mold necessary for manufacturing this packaging container is also owned in-house. Takemoto Yohki’s primary customers for standard bottles are companies in the fields of cosmetics and beauty, healthy foods, sundries, chemical and pharmaceuticals. Takemoto boasted of 3,463 molds for various packaging containers as of the end of December 2018. Amongst the unique characteristics of the company are its high proposal-based marketing capabilities, bountiful stock of molds, wide range of customers, and ability to provide a wide variety of products on a small lot basis in short delivery times. The company is actively operating business overseas as well. Two subsidiaries are operated in China and one in the United States, the Netherland, Thailand, and India.
1-1 Corporate History
Shigeru Takemoto (Grandfather of the current President Emiko Takemoto) started his business under the name of Takemoto Shoten in 1950, amidst the shortages of goods in the post-World War II era, for the recycling of glass products. In 1953, Mr. Takemoto converted his business into a limited company and renamed it Takemoto Yohki Co., Ltd. and began selling glass containers. In 1963, Takemoto started dealing in its signature brand “standard bottles.”
A regional sales office was opened in Osaka in 1980. Masahide Takemoto (Currently advisor to the company and the father of Emiko Takemoto) took the helm of the company and explored new markets in the Kansai region, where its main sales had been limited to “custom made” products, with bottle dealers and accessory dealers being separated. In its efforts, the company leveraged both the “standard bottles” and “one stop product provision.” The wide range of products allowed the company to capture demand from customers and expand its sales channels. After the expansion into the Osaka region, a groundbreaking feat back then, the company further expanded into Fukuoka, Sapporo, and Nagoya regions, and succeeded in building its nationwide sales and service coverage network.
1984: | As a means of strengthening its competitive capabilities, Takemoto added the manufacturing function in addition to its trading firm capability and started plastic container processing and printing along with the opening of the Yoshikawa Plant (Yoshikawa City, Saitama Prefecture). |
1996: | Takemoto led the industry by creating a manufacturing and sales subsidiary in China as the starting point of its global strategy. |
2004: | Emiko Takemoto was appointed as the representative director and president of the company. The company is continuing its efforts in increasing its share of the Japanese market and cultivating overseas markets. |
12/2014: | Takemoto Yohki Co., Ltd. listed its shares on the Second Section of the Tokyo Stock Exchange. In June 2017, the company was assigned to the First Section of the Tokyo Stock exchange. |
1-2 Corporate Motto and Mission Statement
Corporate Motto |
Creating bottles with our customers’ hearts in mind |
|
Mission Statement |
Ensuring the safety of our customers’ products of various substances and contents and increasing their value and individuality through the provision of packaging containers, which are imperative to people’s daily lives |
The dream of the company founder of conducting business in China, the birthplace of the container culture, through collaborative partnerships with local companies came to fruition with the launch of business in 1996. The current president Emiko Takemoto also places a high emphasis upon instilling and diffusing both the corporate philosophy and mission to employees through training and various other occasions.
1-3 Market Environment
As demonstrated in the graph shown below, the market value of the shipments of packaging containers has remained unchanged in recent years. Since the population decline is expected to continue in the future, it is difficult to expect significant growth in the domestic demand.
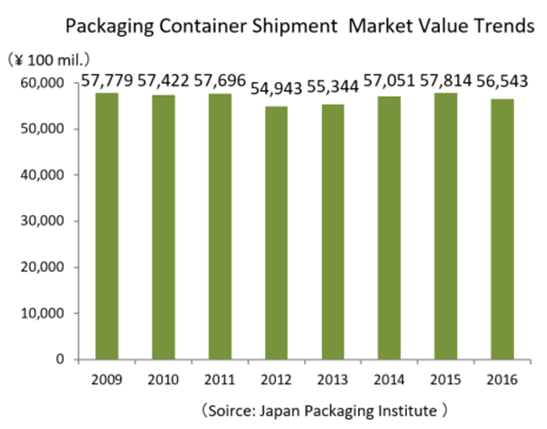
Having said that, demand for the company’s “standard bottles” is expected to keep growing due to the following circumstances:
*Maturing of the consumer market, diversification of consumer tastes and expansion in sales over the internet have contributed to a shortening of the product lifecycle, signaling the end of the era of “mass production, mass sales” and the start of the era of “high-mix low-volume production.”
*Furthermore, Takemoto’s customers, namely cosmetics and toiletries manufacturers, are undergoing trends that call for “shorter product development periods” and “cost reductions.”
*Consequently, customers confronted by these trends are expected to rely less on in-house packaging container development and more on Standard Bottle products, which can be procured at the required time and in the required volumes.
At the same time, companies’ shares of the ¥155.8 billion cosmetics and toiletry container market in 2008 were as follows:
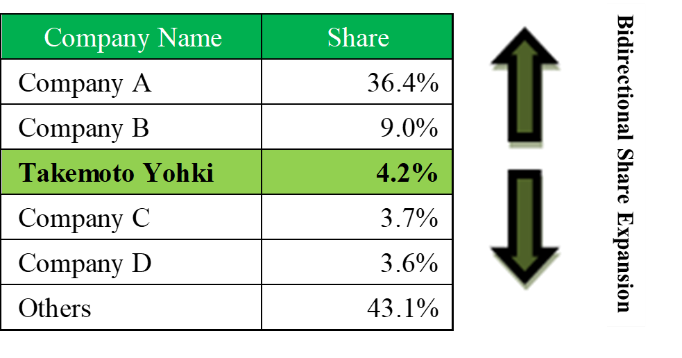
The custom bottle segment of the market, where customers own the rights and bear the cost of metal molds, is estimated to account for 70% to 80% of the total market, with generic bottles accounting for the remaining 20% to 30% of total market. Furthermore, Takemoto Yohki estimates that its Standard Bottle brand of generic bottles account for about 20% of the total generic bottle segment of the market.
The main customers of company A and company B, the top two companies with the largest market shares, are large cosmetics companies which make mold investments on their own. Considering this fact, Takemoto Yohki, focused on its proposal-based marketing capabilities, which have been developed over a long time as its distinctive strength, has established a mass production structure that delivers products speedily and precisely at a low price, also with partner manufacturers. With this structure, the company seeks to expand the sales of products made from molds manufactured by customers.
Takemoto Yohki, a company which possesses both trading and manufacturing capabilities, has an advantage in terms of its product variety while most low market-share companies sell Standard Bottles through trading companies. By realizing cost reduction in development as a manufacturer, the company aims to improve the price competitiveness to increase its market share.
In addition, because standard bottles which require mold investment need continual investment, strong financial capabilities are required. In this aspect, Takemoto Yohki, the only listed company in its industry, holds a major advantage.
This way, the company aims to expand its market share compared with upper and lower competitors. As mentioned below, the sales of products for cosmetics and beauty for the fiscal year December 2017 increased by 7.9% versus those in the previous term, with a higher growth rate than the average in the cosmetic market. The current market share is considered to be higher than the above mentioned 4.2% as of 2008.
A growing overseas market
The cosmetics market in developing nations, primarily in Asia, is rapidly growing.
In five years, the Chinese market has grown in scale by 50%. Surpassing the Japanese market in 2017, India along with other ASEAN countries are expected to experience a high rate of growth as well.
There is a high level of trust in Japanese-made bottles in developing countries which means huge potential for business.
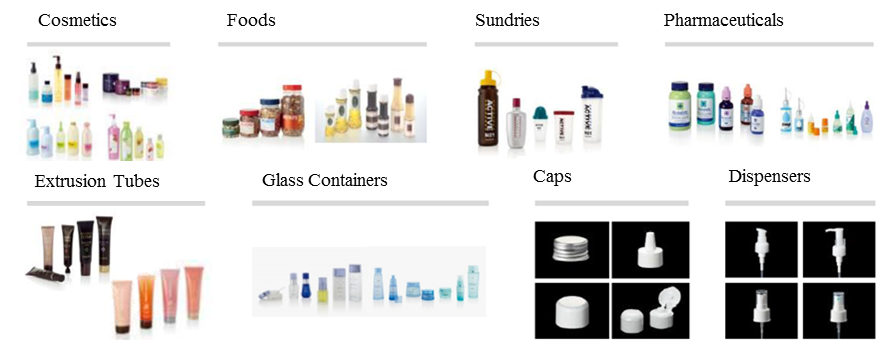
1-4 Business Description
Takemoto Yohki Co., Ltd. manufactures and sells containers and accessories such as caps and dispensers, for use by customers in the cosmetics and beauty, healthy foods, sundries, chemical, and pharmaceuticals industries. The company does not manufacture merely containers to hold substances; it primarily creates high added-value products while paying close attention to design, function, barriers, safety, and environmental issues.
(Source: Takemoto Yohki)
(Source: Takemoto Yohki)
Business Model
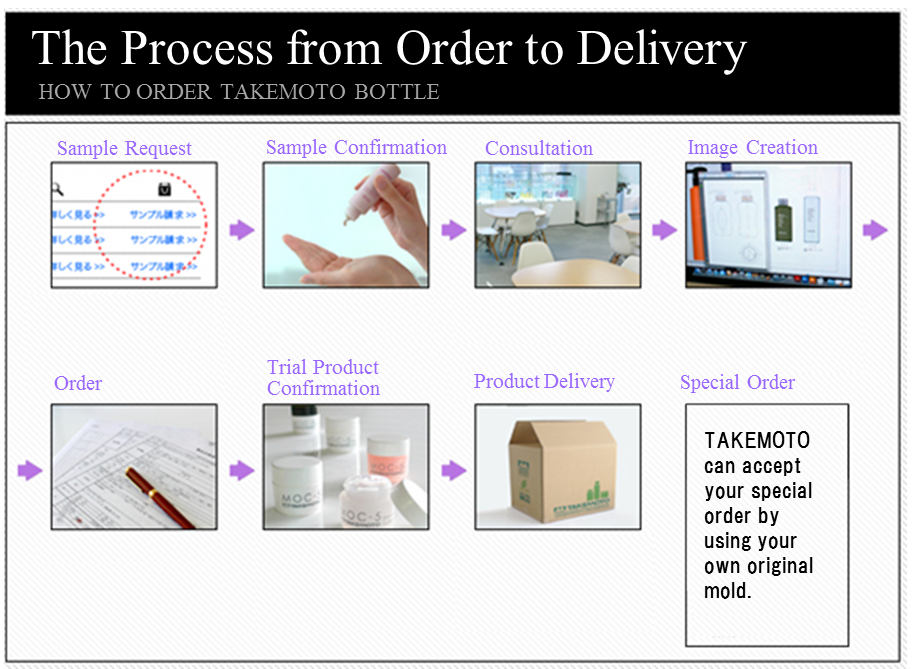
When a cosmetics and toiletry product manufacturer or customer commissions a container manufacturer to produce a unique and differentiated type of container, in most cases the container manufacturer is responsible for designing and manufacturing of custom-made products while the customer shoulders the cost of creating molds. The time and cost of creating molds, however, is usually a heavy burden when sourcing containers because they take as about three months and cost about several million yen.
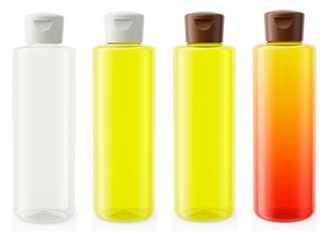
In contrast to the above, Takemoto Yohki creates molds in-house on behalf of the customer. By allowing the customer to choose molds of their preference from a wide range of products, Takemoto manufactures and delivers the desired products. Therefore, the delivery time and development costs of packaging containers are reduced, and customers can purchase only the required amount of containers as needed at that time. In this manner, Takemoto Yohki is able to plan and create its own brand of containers, called “standard bottles,” through this strategy of creating and owning the molds in-house.
As of the end of December 2018, the company boasts 3463 different types of molds, which is the largest number in the industry, worldwide.
At the same time, Takemoto can offer customized products that match customers’ needs by using different caps and other accessory parts, and by changing the color and printing used on the Standard Bottle products. Furthermore, the company maintains inventories of certain products, thus being able to realize short delivery times of a wide variety of products in small lots.
(Source: Takemoto Yohki website)
(Source: Takemoto Yohki website)
The company sells its products in Japan, China, the United States, and other regions throughout the world, and the entire Takemoto Yohki group conducted business with more than 4,500 customers in fiscal year December 2017.
Standard Bottle sales comprise approximately 70% of total sales. In addition, the company deals with custom-made products manufactured with molds paid for/owned by customers and, as a trading company, it purchases products made by other companies.
(Taken from the material of the company)
Production System
The company has established a global production system that includes 6 bases in Japan, 2 bases in China, 1 base in India, and 1 manufacturing affiliate in the Netherlands. In August 2018, they strengthened the Okayama branch, reinforcing the product supply structure.
Its domestic manufacturing thoroughly meets the needs of its clients, such as small batches and multi-products, short deadlines, stable quality, wide range of product lines, sudden orders, and mass production.
In China, the company is concentrating on upgrading its production capabilities and improving product quality.
1-5 ROE Analysis
| FY12/14 | FY12/15 | FY 12/16 | FY 12/17 | FY 12/18 |
ROE (%) | 13.1 | 15.5 | 14.5 | 14.3 | 14.8 |
Net Profit to Sales Ratio | 5.25 | 6.77 | 6.53 | 6.94 | 7.56 |
Asset Turnover Ratio (x) | 1.19 | 1.16 | 1.08 | 1.04 | 1.02 |
Leverage (x) | 2.09 | 1.98 | 2.04 | 1.97 | 1.91 |
The company achieved high ROE with rising profit to sales ratio also in the fiscal year December 2018. It will endeavor to achieve a stable level of ROE 15% or above over the medium term.
1-6 Characteristics and Strengths
1-6-1 Broad Customer Base
Takemoto Yohki boasts of an extremely wide range of clients with some 4,500 customers within and outside Japan. In addition, no single client contributes more than 10% of the total sales and the stable cash flow secured from this client base enables continuous investment into molds. Furthermore, the company’s high-quality proposal-based marketing capability contributes to high levels of customer satisfaction and repeat business.
1-6-2 Bountiful Stock of Molds
As explained earlier, the bountiful stock of 3,390 molds allows Takemoto Yohki to respond flexibly to customers’ needs. In addition, the company is fortifying its product lineup and promoting development of high- added-value- container products with design and functionality taken into consideration. At the same time, efforts are being made to reduce investment burden and risks by standardizing, communizing, and miniaturizing.
1-6-3 Flexible Product Supply Structure and Meeting production needs
In addition to 6 bases in Japan and 3 bases overseas (2 in China and 1 in India), the company has recently established a manufacturing affiliate in the Netherlands. Through a production network that cooperates and complements each other, the company has built a global product supply system capable of delivering a large variety of high-quality products quickly and in small lots.
Moreover, new manufacturing technologies are being introduced aggressively with product cost, strength and quality in mind, in order to respond to customers’ needs for customized products.
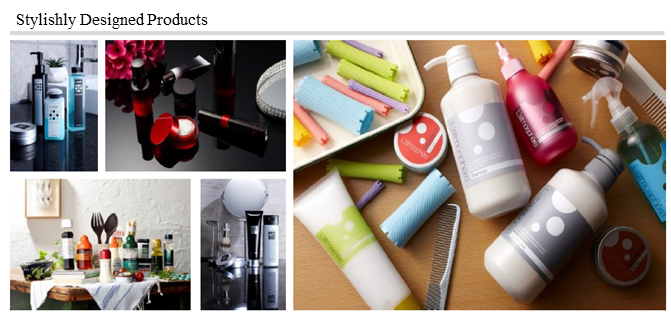
1-6-4 “High Levels of Development and Proposal-Based Marketing”
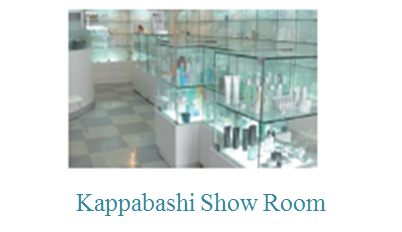
The high levels of development and proposal-based marketing capabilities are the source of the sustained increase in corporate value and contribute to the establishment of a wide customer base. Through planning, development and technology about 30 staff endeavor to realize various ideas for products, taking materials, shapes, functionality, and safety into consideration. About 1,000 types of Standard Bottle brand products are on display at the Kappabashi Showroom and it reflects the high levels of development and proposal-based marketing capabilities of the company.
(Source: Takemoto Yohki)
By using its Standard Bottle development foundation and its bountiful stock of molds, the company has been offering development proposals to customers while providing them with high-quality original molds with low prices and short delivery times. The company calls such an endeavor "custom bottle innovation" and has been promoting it more aggressively. In addition, the company is constructing a design laboratory to further strengthen the capability of the proposing development.
1-6-5 Four aspects highly evaluated by customers
Based on the above-mentioned “broad and multi-layered customer base,” Takemoto is highly evaluated for its ability to meet customer needs with its high-quality proposal-based marketing capability; abundant mold stock, options for customization, and flexible product supply structure, and ability to meet production needs.
2. Fiscal Year December 2018 Earnings Results Overview
2-1 Earnings Overview
| FY12/17 | Share | FY12/18 | Share | YY | Compared with the initial forecasts | Compared with revised forecasts |
Sales | 14,201 | 100.0% | 16,022 | 100.0% | +12.8% | +8.8% | +3.4% |
Gross Profit | 4,301 | 30.3% | 4,817 | 30.1% | +12.0% | - | - |
SG&A | 2,888 | 20.3% | 3,186 | 19.9% | +10.3% | - | - |
Operating Profit | 1,412 | 9.9% | 1,630 | 10.2% | +15.5% | +21.8% | +8.4% |
Current Profit | 1,440 | 10.1% | 1,762 | 11.0% | +22.3% | +31.7% | +15.1% |
Net Profit | 986 | 7.0% | 1,211 | 7.6% | +22.8% | +33.3% | +18.0% |
*Unit: Million Yen
Sales grew due to increased sales of standard and custom bottles. Depreciation costs were offset, and profit rose.
Sales were ¥16,022 million, up 12.8% year on year. The company captured demand for standard bottles and custom bottles both in Japan and overseas.
Operating profit grew 15.5% to ¥1,630 million.
SG&A expenses augmented 10.3% year on year due to greater depreciation costs and a rise in personnel expenses accompanying increases in production, but was offset by the growth in sales.
Both sales and profits exceeded initial and revised estimates. Reflecting strong business performance, the term-end dividend was increased ¥3/share to ¥20 /share, raising the estimated annual dividend from ¥34/share to ¥37 /share.
(Accounting for the 2-for-1 stock split on Jan. 1, 2019, the estimated annual dividend is ¥18.50/share, an increase of ¥1.5/share from the previous term.)
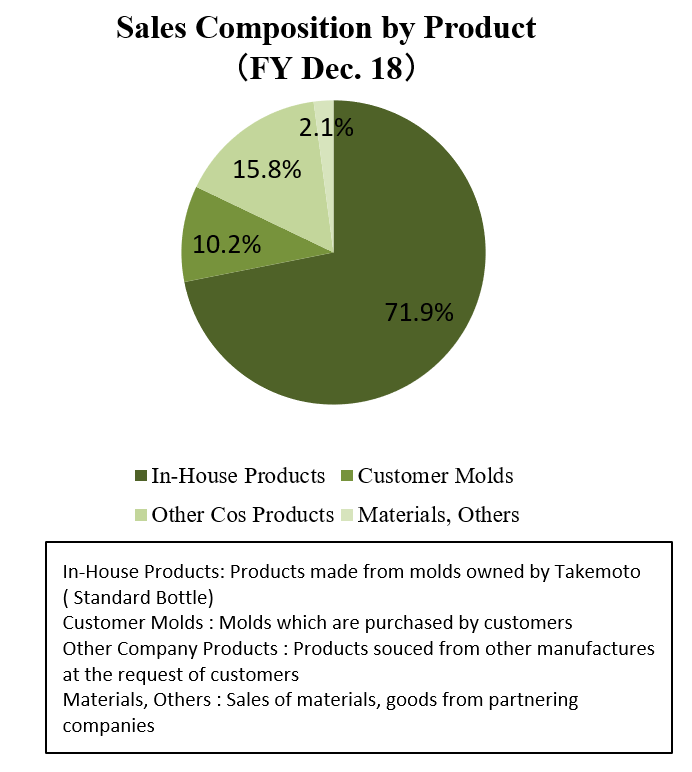
Sales by Product Type
| FY12/17 | Share | FY12/18 | Share | YY |
Products Made by the Company | 10,225 | 72.0% | 11,515 | 71.9% | +12.6% |
Products Made with Molds Paid for/Owned by Customers | 1,596 | 11.2% | 1,636 | 10.2% | +2.5% |
Products Manufactured by Other Companies | 2,063 | 14.5% | 2,532 | 15.8% | +22.7% |
Materials and others< | 315 | 2.2% | 336 | 2.1% | +6.7% |
Total | 14,201 | 100.0% | 16,022 | 100.0% | +12.8% |
*Unit: Million Yen
Due to the promotion of proposals for development and an increase in repeat orders, sales of standard bottles increased in Japan and China.
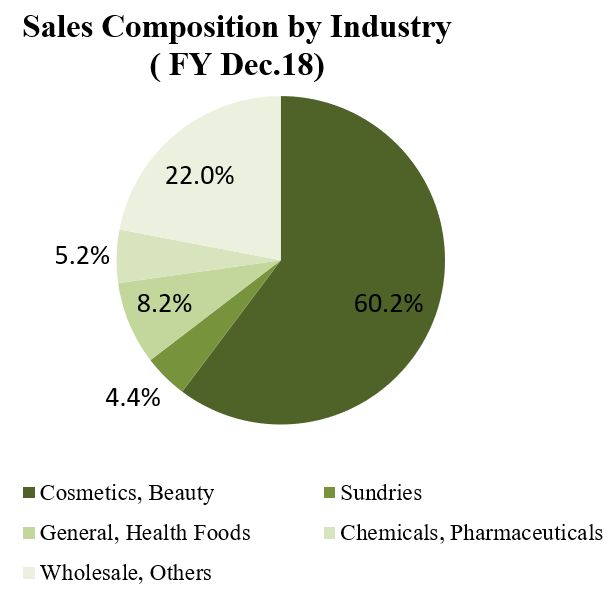
Sales by Field Type
| FY12/17 | Share | FY12/18 | Share | YY |
Cosmetic, beauty | 8,512 | 59.9% | 9,651 | 60.2% | +13.4% |
Sundries, | 685 | 4.8% | 697 | 4.4% | +1.8% |
Foods, health foods | 1,221 | 8.6% | 1,310 | 8.2% | +7.3% |
Chemical and pharmaceuticals | 661 | 4.7% | 838 | 5.2% | +26.6% |
Wholesale, others | 3,119 | 22.0% | 3,523 | 22.0% | +13.0% |
Total | 14,201 | 100.0% | 16,022 | 100.0% | +12.8% |
*Unit: Million Yen
Through the fortification of the product lineup for standard bottles and sales activities based on proposals for development, sales grew mainly for cosmetics and beauty products.
Capital Investment, Depreciation
| FY12/17 | FY12/18 |
Depreciation | 928 | 1,021 |
Capital Investment | 1,728 | 1,946 |
Out of which Molds | 405 | 476 |
*Unit: Million Yen
Regional Trends
Sales | FY12/17 | FY12/18 | YY Change | Divergence from Est. |
Japan | 11,018 | 12,063 | +9.5% | +4.3% |
China (JPY base) | 3,094 | 3,921 | +26.7% | -0.2% |
China (RMB base) | 186 | 234 | +26.0% | -0.8% |
Operating Profit |
|
|
|
|
Japan | 1,077 | 1,242 | +15.3% | +9.9% |
China (JPY base) | 337 | 515 | +52.9% | +0.5% |
China (RMB base) | 20 | 30 | +52.1% | -0.2% |
*Unit: Million Yen
Japan
The demand for cosmetic-related products grew due to the favorable business performance of client companies.
Orders have increased due to the aggressive expansion of business involving development and proposal-based marketing.
Product supply augmented due to increased production capacity in Japan, including the addition of more production-related machinery at the Okayama Plant.
Although material and labor costs rose along with the increased product supply, both gross profit and the profit-to-sales ratio improved thanks to increases in productivity.
As a result, the company was able to offset the rise in SG&A expenses.
China
Sales grew significantly due to steady repeat orders. Sales of standard bottles increased substantially due to development and proposal-based marketing.
SG&A expenses augmented, largely due to personnel costs. However, the company managed to keep the rate of growth for SG&A expenses low, and the operating profit margin rose to over 13%.
Plastic raw material prices remained almost unchanged from the same period in the previous term.
2-2 Financial Conditions and Cash Flow
Balance Sheet
| End Dec.17 | End Dec.18 |
| End Dec.17 | End Dec.18 |
Current Assets | 6,827 | 8,340 | Current Liabilities | 4,178 | 4,689 |
Cash, Equivalents | 2,342 | 3,020 | Payables | 2,199 | 2,593 |
Receivables | 2,983 | 3,422 | ST Interest Bearing Liabilities | 459 | 531 |
Inventories | 1,285 | 1,566 | Noncurrent Liabilities | 2,499 | 3,486 |
Noncurrent Assets | 7,723 | 8,390 | LT Interest Bearing Liabilities | 2,222 | 3,184 |
Tangible Assets | 7,021 | 7,573 | Total Liabilities | 6,677 | 8,175 |
Buildings and structures (Net Depreciation) | 3,188 | 3,474 | Net Assets | 7,872 | 8,555 |
Intangible Assets | 439 | 428 | Shareholders’ Equity | 7,364 | 8,356 |
Investments, Others | 262 | 388 | Total Liabilities, Net Assets | 14,550 | 16,730 |
Total Assets | 14,550 | 16,730 | Total Interest-bearing Liabilities | 2,682 | 3,716 |
*Unit: Million Yen
Current assets increased ¥1513 million from the end of the previous term, due to the augmentation of cash and deposits and receivables. Noncurrent assets grew ¥666 million due to the rise in tangible assets. Accordingly, total assets rose ¥2180 million from the end of the previous term to ¥16730 million. Total liabilities grew ¥1497 million to ¥8175 million due to an increase in long-term debts.
Net assets increased ¥682 million to ¥8555 million due to the rise in retained earnings.
As a result, capital adequacy ratio fell 3% from the end of the previous term to 50.9%.
Cash Flow
| FY12/17 | FY12/18 | YY Change |
Operating Cash Flow | 2,241 | 2,028 | -213 |
Investing Cash Flow | -1,808 | -2,194 | -385 |
Free Cash Flow | 433 | -165 | -599 |
Financing Cash Flow | 170 | 814 | +643 |
Term End Cash, Equivalents | 2,342 | 2,860 | +518 |
*Unit: Million Yen
The surplus of operating CF shrank due to an increase in receivables and inventories.
The deficit of investing CF grew as a result of increased spending on acquisition of tangible assets, causing free CF to turn negative.
Although the income from the issuance of shares that was present in the previous term has ceased, the company gained revenue from long-term borrowing, and the surplus of financing CF grew.
The cash position rose.
2-3 Topics
Progress of mold development
The number of molds of the company is 3,463 as of the end of December 2018.
In Japan and India, the company outsources the production of molds to outside manufacturers, but the Chinese subsidiary produces molds by itself.
Currently, the mold development sections in Japan and China are recruiting personnel and standardizing mold designs, while developing more functional molds.
| The Number of Completed Molds in FY 12/18 | In Progress | Total |
Japan | 137(30) | 75(14) | 212(44) |
China | 117(36) | 44(11) | 161(47) |
India | 3 | 20 | 23 |
Total | 257(66) | 139(25) | 396(91) |
* Numbers in parentheses are metal molds for custom bottles.
3. Fiscal Year December 2019 Earnings Estimates
3-1 Earnings Estimates
| FY12/18 | Share | FY12/19 Est. | Share | YY Change |
Sales | 16,022 | 100.0% | 16,934 | 100.0% | +5.7% |
Operating Profit | 1,630 | 10.2% | 1,678 | 9.9% | +3.0% |
Current Profit | 1,762 | 11.0% | 1,706 | 10.1% | -3.2% |
Net Profit | 1,211 | 7.6% | 1,176 | 6.9% | -2.9% |
*Unit: Million Yen
* Estimates are based on the source from the company
Increase in sales and profits
Sales are forecast to rise 5.7% year on year to ¥16.9 billion. Due to increasingly diverse consumer needs and shorter product cycles, the demand for standard bottles continues to grow, and Takemoto must continue working to reduce the time and money required for development. The company will actively make proposals for development, and new molds will be made. Improvements will be made to the current Okayama Plant, and the Yuki Plant will be expanded and increase its production capacity.
Operating profit is estimated to rise 3.0% year on year to ¥1,678 million. Depreciation expenses are expected to rise ¥177 million, due to the development of new molds, which measuresthe increase in production, and investment into labor-saving equipment. Raw material expenses will grow due to increased production and rising raw material prices, but the company will strive to curb SG&A expenses and raise profits.
Both the interim and term-end dividends are to be ¥9.50 /share. Taking the stock split into account, this is an increase of ¥0.5/share from the previous term. The estimated payout ratio is 20.2%. The company aims to achieve a payout ratio of 20% or higher.
<Capital Investment, Depreciation>
| FY12/18 | FY12/19 Est. |
Depreciation | 1,021 | 1,198 |
Capital Investment | 1,946 | 3,585 |
Out of which Molds | 476 | 700 |
EBITDA | 2,651 | 2,876 |
*Unit: Million Yen
The company plans to increase investment in plants and equipment by 84.2% over the previous term, in order to cope with increased demand and labor shortages, and to lay the foundation for future growth.
The investment in molds also rose 47.1%, a significant increase over the previous term.
4. Medium-term Plan (2019-2021)
4-1 Main Points
The three-year medium-term plan, which starts this term, specifies the following three points.
1. Sustainability (efforts to preserve the environment) | (Current situation) There is a possibility that the standards for development and values with regard to packaging containers will undergo a significant change, as people around the world (and particularly in the EU) become increasingly aware of environmental issues. The company must observe this trend carefully.
(Future plans) The company has a base in Europe, which has a strong influence on the container industry. It plans to use its competitive advantage and integrated manufacturing and sales structure to develop containers that meet the new standards. Furthermore, the company will create new businesses in the field of packaging containers. |
2. Quick and agile business structure | (Current situation) The constantly changing environment and increasing customer demands require the company to improve the lead time and productivity.
(Future plans) Responding to sudden changes requires the company to take quick, intelligent, and precise actions (agile). The company will establish a network where sales, development, and production are connected as closely as possible. In addition, they will strengthen and build a co-education system to develop new skills in employees. |
3. Synergy between data and physical operations | (Creating an agile business structure) The use of data is essential to create an agile business structure. Takemoto will accumulate knowledge and experience, and share it by making it openly accessible within the company.
(Details) The company will gain abundant experience by running design, quality, and production simulations, conducting experiments, and reviewing the performance of actual products. |
4-2 Numerical Targets
4-2-1 Group Trend
| FY12/19(Plan) | YoY | FY12/20(Plan) | YoY | FY12/21(Plan) | YoY |
Sales | 16,934 | +5.7% | 17,952 | +6.0% | 19,173 | +6.8% |
Operating Profit | 1,678 | +2.9% | 1,712 | +2.0% | 1,830 | +6.9% |
Operating Profit on Sales | 9.9% | -0.3p | 9.5% | -0.4p | 9.5% | 0.0p |
Current Profit | 1,706 | -3.2% | 1,722 | +0.9% | 1,836 | +6.6% |
Net Profit | 1,176 | -2.9% | 1,203 | +2.3% | 1,281 | +6.5% |
Depreciation | 1,198 | +17.3% | 1,555 | +29.8% | 1,825 | +17.4% |
Capital Investment | 3,585 | +84.2% | 3,189 | -11.0% | 2,410 | -24.4% |
Out of which Molds | 700 | +47.1% | 759 | +8.4% | 749 | -1.3% |
EBITDA | 2,876 | +8.5% | 3,267 | +13.6% | 3,655 | +11.9% |
*Unit: Million Yen
* To increase production capacity to meet rising demand
Improvements to the existing Okayama building will be completed in the first half of the fiscal year December 2019, and production will start using a two-building setup. Expansion of the Yuki Plant will be completed in the second half.
In 2020, Takemoto will expand the Kunshan Plant (China) and construct an automated warehouse. They will also launch a new business.
In 2021, a new plant will be built in China, and the company will launch another new business.
During these three years, the company will continue to invest in molds, production facilities, and labor-saving equipment.
* To conduct global sales, development, and production activities
The company will coordinate sales, development, and production across Japan, China, Thailand, Europe, the U.S., and India in order to meet the demand..
Plastic raw material prices are expected to rise by double-digits from the previous year in 2019, and increase gradually thereafter.
The estimated exchange rate is 1 RMB to ¥16, and 1 USD to ¥110.
4-2-2 Regional trend
(Japan)
| FY12/19(Plan) | YoY | FY12/20(Plan) | YoY | FY12/21(Plan) | YoY |
Sales | 12,431 | +3.1% | 13,045 | +4.9% | 13,758 | +5.5% |
Operating Profit | 1,192 | -4.0% | 1,224 | +2.7% | 1,445 | +18.1% |
Operating Profit on Sales | 9.6% | -0.7p | 9.4% | -0.2p | 10.5% | +1.1p |
*Unit: Million Yen
Sales are expected to continue growing. The company will continue to invest in molds for standard bottle development, and in plant and equipment in order to boost production capacity.
It is estimated that sales will increase in 2019, but high material costs and depreciation expenses will cause profits to decline. Profitability is forecasted to improve from 2021.
(China)
| FY12/19(Plan) | YoY | FY12/20(Plan) | YoY | FY12/21(Plan) | YoY |
Sales | 4,207 | +7.3% | 4,548 | +8.1% | 4,914 | +8.0% |
Operating Profit | 586 | +13.8% | 569 | -2.9% | 450 | -20.9% |
Operating Profit on Sales | 13.9% | +0.8p | 12.5% | -1.4p | 9.2% | -3.3p |
*Unit: Million Yen
In 2019, the company will invest in molds and work to increase productivity, and the company anticipates a rise in sales and profits. From 2020 onwards, depreciation expenses will increase with the expansion of the Kunshan Plant and the construction of the new plant in China, resulting in a decline in profits.
(Others)
| FY12/19(Plan) | YoY | FY12/20(Plan) | YoY | FY12/21(Plan) | YoY |
Sales | 564 | +75.2% | 892 | +58.2% | 1,125 | +26.1% |
Operating Profit | -101 | - | -81 | - | -66 | - |
Operating Profit on Sales | - | - | - | - | - | - |
*Unit: Million Yen
In India, full-scale production and sales targeted at the domestic market will begin in 2019. The company will respond to inquiries and work to secure new projects, leading to an increase in sales. Its aim is to turn a profit by 2024.
In the Netherlands, the company will begin locally outsourcing production in 2019. It will commence full-scale investment in molds, leading to an increase in sales.
*Global network of the company
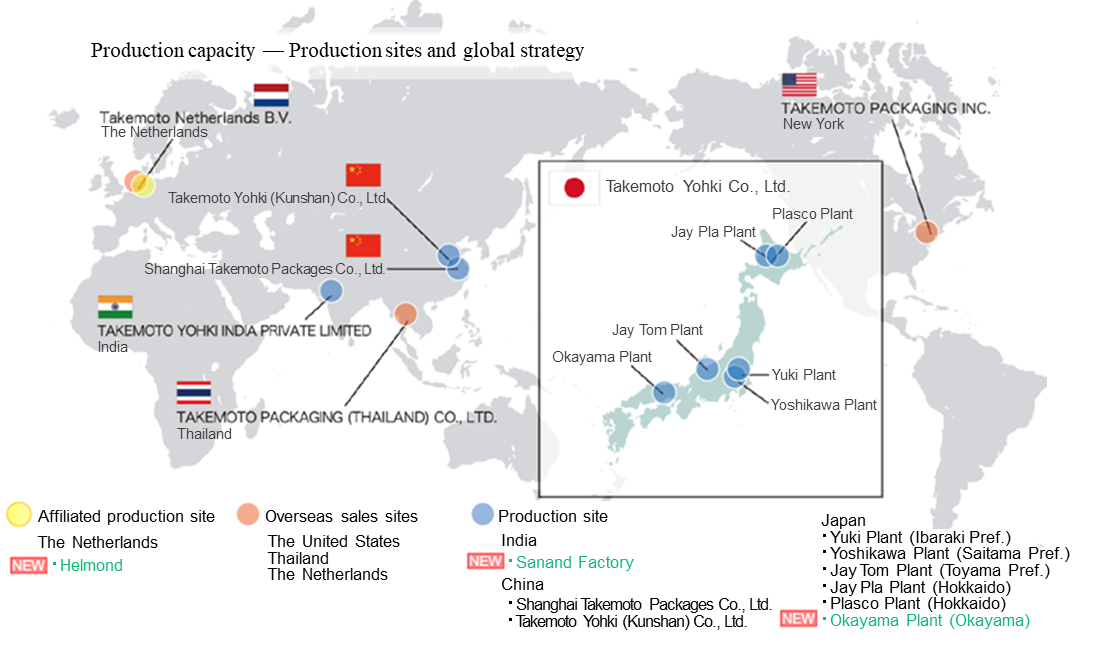
(Source: the company)
5. Conclusions
Although the price of raw materials rose, and depreciation and personnel expenses increased, both sales and profits grew by double-digits, surpassing estimates.
The rate of increase in sales and profit is expected to remain in the single digits this term, but the figures announced in Jan. 2019 for the medium-term plan are higher than the figures that were announced in Feb. 2018, so we anticipate steady growth for the time being. In addition to strong business performance in Japan, we are interested in the significant sales growth seen in China, India, and the Netherlands.
While focusing on current business performance, we look forward to what the “creation of new business” mentioned in the mid-term plan will entail.
<Reference: Regarding Corporate Governance>
◎Organizational Composition and Director and Auditor Composition
Organization Structure | Company with audit and supervisory committees |
Directors | 8 directors of whom 4 are outside directors |
◎ Corporate Governance Report
Takemoto Yohki released its latest Corporate Governance Report on December 28, 2018.
<Reasons for Non-compliance with the Principles of the Corporate Governance Code (Excerpts)>
Principles | Reasons for not implementing the principles |
[Supplementary Principle 1-2-4 Electronic Exercising of Voting Rights to Shareholder’s Meeting/English Translation of Convocation of Notice] [Supplementary Principle 3-1-2 Disclosure and Provision of Information in English] | We recognize the necessity to provide information in English for investors outside Japan and establishing an environment in which it is easy to exercise voting rights in accordance with the state of the shareholding structure of corporate investors, etc. In the future, we will consider creating an environment that enables electronic exercise of voting rights (use of a platform to electronically exercise voting rights etc.) and translating the Convocation of Notice and other documents while taking the ratio of overseas investors in shareholders into account. |
[Supplementary Principle 4-11-3 Evaluating Effectiveness of Board of Directors] | The board of directors will have regular meetings once a month and when deemed necessary will hold adequate meetings to decide and report important matters related to the execution of operations. Moreover, the board of directors will actively discuss issues in managerial strategies, governance and administration, as well as exchange opinions on the management situation of the board of directors. However, the Board of Directors’ effectiveness has yet to be evaluated. |
<Disclosure Based on the Principles of the Corporate Governance Code (Excerpts)>
Principles | Disclosure contents |
[Principle 1-4 So-called strategically held shares] | Our company will retain shares of clients when the judgment is made that building a stable and long-term business relationship or collaborating would contribute to improving the mid- to long-term value of our company. Currently, strategically held shares account for less than 0.1% of the company’s total assets, so the financial impact is extremely low. The strategically held shares, which place high importance in funds, will be regularly examined by the Board of Directors to determine the necessity and rationality in continuing to retain them. As for shares that have begun to lose their strategic importance, we will open dialogues with our business partners and work to reduce the number of those shares. In terms of exercising voting rights on them, judgment on the vote will be made from the perspective of whether it will contribute to improving the mid- to long-term value of said company and our company. |
This report is intended solely for information purposes, and, it is not intended as a solicitation to invest in the shares of this company. The information and opinions contained within this report are based on data made publicly available by the company, and they come from sources that we judge to be reliable. However, we cannot guarantee the accuracy or completeness of the data. This report is not a guarantee of the accuracy, completeness or validity of said information and or opinions, nor do we bear any responsibility for the same. All rights pertaining to this report belong to Investment Bridge Co., Ltd., which may change the contents thereof at any time without prior notice. All investment decisions are the responsibility of the individual and should be made only after proper consideration. Copyright(C) 2019, Investment Bridge Co., Ltd. All Rights Reserved. |