Bridge Report:(4248)Takemoto Yohki the Fiscal Year December 2019
![]()
 Emiko Takemoto, President | Takemoto Yohki Co., Ltd. (4248) |
 |
Company Information
Exchange | First Section, TSE |
Industry | Chemical (Manufacturing) |
President | Emiko Takemoto |
HQ Address | 2-21-5 Matsugaya, Taito-ku, Tokyo |
Year-end | End of December |
Homepage |
Stock Information
Share Price | Shares Outstanding | Market Cap. | ROE (actual) | Trading Unit | |
JPY 629 | 12,528,400 shares | JPY 7,880 million | 11.8% | 100 shares | |
DPS (Est.) | Dividend Yield (Est.) | EPS (Est.) | PER (Est.) | BPS (actual) | PBR (actual) |
JPY 19.00 | 3.0% | JPY 87.80 | 7.2x | JPY 732.37 | 0.9x |
*The share price is the closing price on March 31. Each number was taken from the financial report of FY 12/19
Earnings Trend
Fiscal Year | Sales | Operating Income | Ordinary Income | Net Income | EPS (¥) | Dividend (¥) |
FY12/16 | 12,799 | 1,259 | 1,279 | 836 | 73.65 | 15.00 |
FY12/17 | 14,201 | 1,412 | 1,440 | 986 | 82.29 | 17.00 |
FY 12/18 | 16,022 | 1,630 | 1,762 | 1,211 | 96.72 | 18.50 |
FY 12/19 | 15,196 | 1,538 | 1,575 | 1,043 | 83.31 | 19.00 |
FY 12/20 Est. | 15,500 | 1,600 | 1,600 | 1,100 | 87.80 | 19.00 |
*Estimates are those of the company. 1:2 stock split on January 1st, 2019 was implemented. EPS and DPS have been retroactively adjusted to reflect these splits. The definition for net income is net income attributable to parent company shareholders. The same applies hereinafter.
We hereby present the summary of the Fiscal Year ended in December 2019 for Takemoto Yohki Co. Ltd.
Table of Contents
Key Points
1.Company Overview
2.Fiscal Year ended December 2019 Earnings Results
3.Fiscal Year ending December 2020 Earnings Forecasts
4.Regarding the mid-term plan
5.Conclusions
<Reference: Regarding Corporate Governance>
Key Points
- The sales for the term ended December 2019 were 15,196 million yen, down 5.2% year on year. In Japan, sales fell below the estimate significantly, due to the recoil from the growth of demand for cosmetics in the previous year and the decline of inbound demand. Overseas sales declined from the previous term, falling below the estimate, due to the drop in demand in China caused by the EC regulations, the trade friction between the U.S. and China, etc., and the delay in the launch of new products in new markets. Operating income was 1,538 million yen, down 5.7% year on year. The procurement of resale materials decreased, and the rise in prices of raw materials was within the scope of assumption, but the company was not able to offset the augmentation of costs, due to the drop in sales.
- For the term ending December 2020, sales are estimated to be 15.5 billion yen, up 2.0% year on year. The needs for standard bottles are expected to keep growing. Performance is projected to be sluggish in the first half of the year, due to the lingering effects of recoil from advanced procurement in 2018. Outside Japan, the full-scale sale in India is expected. Operating income is forecasted to be 1.6 billion yen, up 4.0% year on year. Through the revision to the capital investment plan, large-scale investment was put off, so that the augmentation of depreciation will be inhibited. Profit is estimated to rise, due to the curtailment of SG&A expenses. The annual dividend is to be 19.00 yen/share, as the interim and term-end dividends are both 9.50 yen/share like in the previous term. The estimated payout ratio is 21.6%.
- Considering the changes in the business environment, including the decline of inbound demand, etc., the company revised the mid-term plan (2019 to 2021), which was announced in January 2019, and announced the mid-term plan (2020 to 2022) in January 2020. The large-scale equipment investment in China will be postponed one year.
- Although the domestic demand for containers is expected to grow slightly in 2020, domestic annual sales are estimated to be unchanged from 2019. While the expansion of production footholds will be put off for a while, the company will continue its investment to develop containers for sustainability, enrich the product lineup outside Japan, and in automation for improving production efficiency, etc.
- From a short-term viewpoint, the impact of coronavirus disease (COVID-19) has not been taken into account, and there are concerns over the effects of the shrinkage of inbound demand on the domestic demand, whose expansion rate has been decreasing. From a mid-term viewpoint, we would like to pay attention to the progress of the mid-term plan, in which capital investment has been put off, inside and outside Japan and how “TOGETHER LAB,” which will be put into operation in April, will produce positive effects.
1.Company Overview
Takemoto Yohki Co., Ltd. plans and designs “standard bottles.” A “Standard Bottle” is a term to refer to a packaging container when it is planned and designed in-house and, at the same time, when the mold necessary for manufacturing this packaging container is also owned in-house. Takemoto Yohki’s primary customers for standard bottles are companies in the fields of cosmetics and beauty, healthy foods, sundries, chemicals and pharmaceuticals. Takemoto boasted of 3,569 molds for various packaging containers as of the end of December 2019. Amongst the unique characteristics of the company are its high proposal-based marketing capabilities, bountiful stock of molds, wide range of customers, and ability to provide a wide variety of products on a small lot basis in short delivery times. The company is actively operating business overseas as well. Two subsidiaries are operated in China and one in the United States, the Netherlands, Thailand, and India.
1-1 Corporate History
Shigeru Takemoto (Grandfather of the current President Emiko Takemoto) started his business under the name of Takemoto Shoten in 1950, amidst the shortages of goods in the post-World War II era, for the recycling of glass products. In 1953, Mr. Takemoto converted his business into a limited company and renamed it Takemoto Yohki Co., Ltd. and began selling glass containers. In 1963, Takemoto started dealing in its signature brand “standard bottles.”
A regional sales office was opened in Osaka in 1980. Masahide Takemoto (Currently advisor to the company and the father of Emiko Takemoto) took the helm of the company and explored new markets in the Kansai region, where its main sales had been limited to “custom made” products, with bottle dealers and accessory dealers being separated. In its efforts, the company leveraged both the “standard bottles” and the “one stop shop” concept. The wide range of products allowed the company to capture demand from customers and expand its sales channels. After the expansion into the Osaka region, a groundbreaking feat back then, the company further expanded into Fukuoka, Sapporo, and Nagoya regions, and succeeded in building its nationwide sales and service coverage network.
In 1984, as a means of strengthening its competitive capabilities, Takemoto added the manufacturing function in addition to its trading firm capability and started plastic container processing and printing along with the opening of the Yoshikawa Plant (Yoshikawa City, Saitama Prefecture).
In 1996, Takemoto led the industry by creating a manufacturing and sales subsidiary in China as the starting point of its global strategy. In 2004 Emiko Takemoto was appointed as the representative director and president of the company. The company is continuing its efforts in increasing its share of the Japanese market and cultivating overseas markets. In 12/2014 Takemoto Yohki Co., Ltd. listed its shares on the Second Section of the Tokyo Stock Exchange. In June 2017, the company was assigned to the First Section of the Tokyo Stock exchange.
1-2 Corporate Motto and Mission Statement
Corporate Motto |
Creating bottles with our customers’ hearts in mind |
|
Mission Statement |
Ensuring the safety of our customers’ products and increasing the value and individuality of the contents through the packaging containers which are imperative to people’s daily lives |
The company founder’s dream of conducting business in China, the birthplace of the container culture, through collaborative partnerships with local companies came to fruition with the launch of business in 1996. The current president Emiko Takemoto also places a high emphasis upon instilling and diffusing both the corporate philosophy and mission to employees through training and various other occasions.
1-3 Market Environment
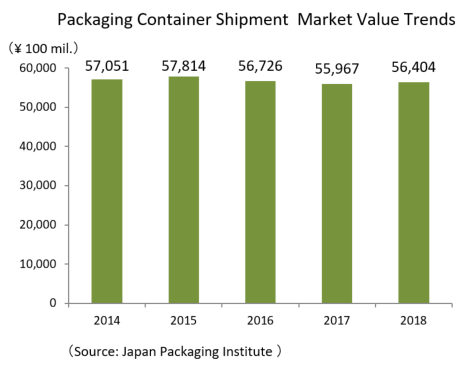
A growing domestic market
As demonstrated in the graph shown below, the market value of the shipments of packaging containers has remained unchanged in recent years. Since the population decline is expected to continue in the future, it is difficult to expect significant growth in the domestic demand.
Growth in the standard bottles market
Having said that, demand for the company’s “standard bottles” is expected to keep growing due to the following circumstances:
* | Maturing of the consumer market, diversification of consumer tastes and expansion in sales over the internet have contributed to a shortening of the product lifecycle, signaling the end of the era of “mass production, mass sales” and the start of the era of “high-mix low-volume production.” |
* | *Furthermore, Takemoto’s customers, namely cosmetics and toiletries manufacturers, are undergoing trends that call for “shorter product development periods” and “cost reductions.” |
* | *Consequently, customers confronted by these trends are expected to rely less on in-house packaging container development and would gain more benefits by adopting Standard Bottle products, which can be procured at the required time and in the required volumes. |
The market trend in cosmetics and toiletry container (estimations are those of the company) is as follows
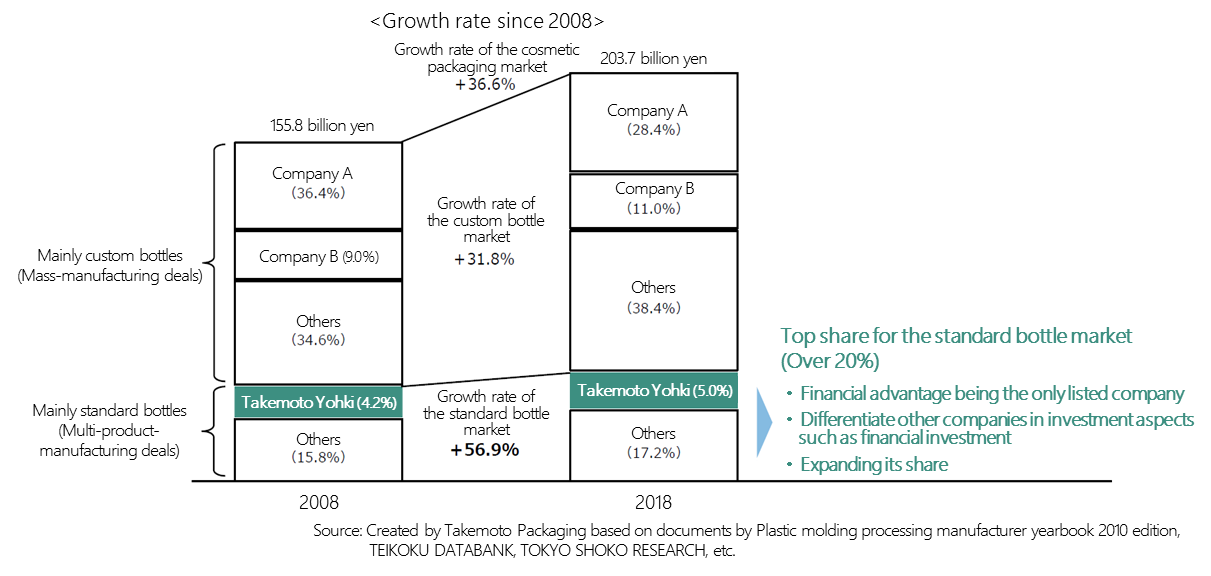
(source: The company)
The scale of this market has expanded about 37% in the past 10 years. In particular, the market of standard bottles has grown 57% at a higher rate than the entire market, due to the improvement in the convenience and popularities of its products.
The ‘custom bottle’ segment of the market, where customers own the rights and bear the cost of metal molds, is estimated to account for around 80% of the total market, with ‘standard bottles’ accounting for the remaining approximately 20% of the total market. Furthermore, the company estimates that its Standard Bottle brand of generic bottles account for over 20% of the top share in the total standard bottle segment of the market.
The main customers of company A and company B, the top two companies with the largest market shares, are large cosmetics companies which invest in their own molds. Considering this fact, Takemoto Yohki, focused on its proposal-based marketing capabilities, which have been developed over a long time as its distinctive strength, and it has established a mass production structure that delivers products speedily and at a low price, while working with reliable partner manufacturers. With this structure, the company is expanding the sales of products made from molds manufactured by customers.
Takemoto Yohki, a company which possesses both trading and manufacturing capabilities, has an advantage in terms of its product variety while most low market-share companies sell Standard Bottles through trading companies. In addition, as a manufacturer, the company will work to reduce development costs, thereby improving price competitiveness.
In addition, firm financial strength is indispensable for conducting continuous investment for producing standard bottles, which requires the investment in molds. Takemoto Yohki is the only listed company in this field, so it possesses great advantages. With these advantages, the company is expanding its market share.
A growing overseas market
The cosmetics market in developing nations, primarily in Asia, is rapidly growing.
In five years, the Chinese market has grown in scale by 50%. Surpassing the Japanese market in 2017, India along with other ASEAN countries are expected to experience a high rate of growth as well.
There is a high level of trust in Japanese-made bottles in developing countries which means huge potential for business.
Over the past 5 years, the company’s sales have grown in each market as tabulated below.
| FY 12/14 | Share | FY 12/19 | Share | CAGR |
Japan | 8,568 | 77.5% | 11,633 | 76.6% | +6.3% |
China | 2,312 | 20.9% | 3,025 | 19.9% | +5.5% |
Other areas | 180 | 1.6% | 537 | 3.5% | +24.4% |
Total | 11,062 | 100.0% | 15,196 | 100.0% | +6.6% |
*Unit: million yen.
The market composition ratio in the future is assumed to be 50% in the Japanese market, 30% in China, and 20% in India, Europe and the United States. We will work to develop the European and American markets with room for expansion and the fast growing Indian market.
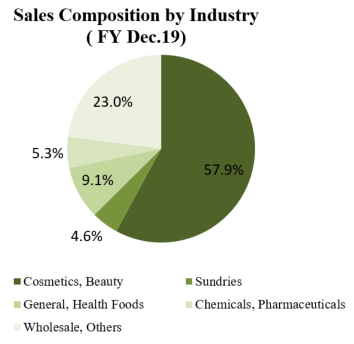
As for the performance for each purpose of use inside and outside Japan, the sales in “the field of cosmetics and beauty,” which has been a growth driver, is estimated to keep growing and account for 63% of the composition ratio in the future.
| FY 12/14 | Share | FY 12/19 | Share | CAGR |
Cosmetic, beauty | 6,472 | 58.5% | 8,802 | 57.9% | +6.3% |
Sundries, | 681 | 6.2% | 705 | 4.6% | +0.7% |
Foods, health foods | 972 | 8.9% | 1,385 | 9.1% | +7.3% |
Chemical and pharmaceuticals | 502 | 4.5% | 812 | 5.3% | +10.1% |
Wholesale, others | 2,433 | 22.0% | 3,490 | 23.0% | +7.5% |
Total | 11,062 | 100.0% | 15,196 | 100.0% | +6.6% |
*Unit: million yen.
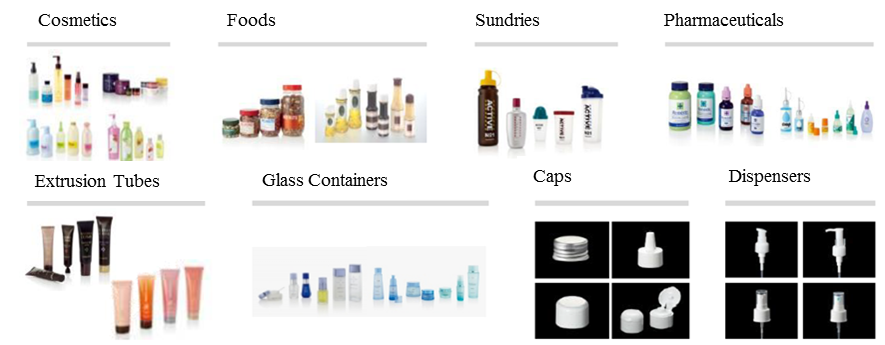
1-4 Business Description
Takemoto Yohki Co., Ltd. manufactures and sells containers and accessories such as caps and dispensers, for use by customers in the cosmetics and beauty, healthy foods, sundries, chemical, and pharmaceuticals industries. The company does not manufacture merely containers to hold substances; it primarily creates high added-value products while paying close attention to design, function, barriers, safety, and environmental issues.
 |
 |
(Source: The company)
(Source: The company)
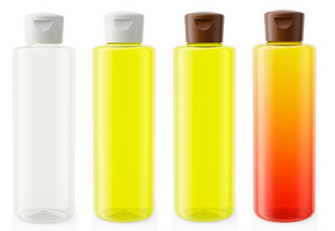
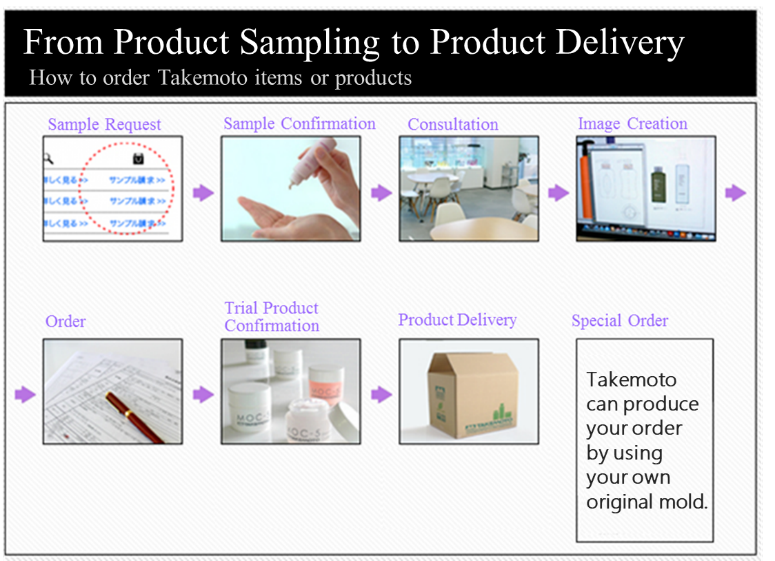
Business Model
When a cosmetics and toiletry product manufacturer or customer commissions a container manufacturer to produce a unique and differentiated type of container, in most cases the container manufacturer is responsible for designing and manufacturing custom-made products while the customer shoulders the cost of creating molds. The time and cost of creating molds, however, is usually a heavy burden when sourcing containers because they may take about three months and cost about several million yen.
In contrast to the above, Takemoto Yohki creates molds in-house on behalf of the customer. By allowing the customer to choose molds of its preference from a wide range of products, Takemoto manufactures and delivers the desired products. Therefore, the delivery time and development costs of packaging containers are reduced, and customers can purchase only the required number of containers as needed at that time. In this manner, Takemoto Yohki is able to plan and create its own brand of containers, called “standard bottles,” through this strategy of creating and owning the molds in-house.
As of the end of December 2019, the company boasts 3569 different types of molds, which is the largest number in the industry, worldwide.
At the same time, Takemoto can offer customized products that match customers’ needs by using different caps and other accessory parts, and by changing the color and printing used on the Standard Bottle products. Furthermore, the company maintains inventories of certain products, thus being able to realize short delivery times of a wide variety of products in small lots.
 |
 |
(Source: The company website)
The company sells its products in Japan, China, the United States, and other regions throughout the world, and the entire Takemoto Yohki group conducted business with about 4,400 customers in fiscal year December 2019.
Standard Bottle sales comprise approximately 70% of total sales. In addition, the company deals with custom-made products manufactured with molds paid for/owned by customers and, as a trading company, it purchases products made by other companies.
(Taken from the material of the company)
Production System
The company has established a global production system that includes 6 bases in Japan, 2 bases in China, 1 base in India, and 1 manufacturing affiliate in the Netherlands. In June 2019, the renovation work for the existing building at the Okayama branch was completed, and there are now two buildings for production.
Its domestic manufacturing thoroughly meets the needs of its clients, such as small batches and multi-products, short deadlines, stable quality, wide range of product lines, sudden orders, and mass production.
In China, the company is concentrating on upgrading its production capabilities and improving product quality.
1-5 ROE Analysis
| FY 12/14 | FY 12/15 | FY 12/16 | FY 12/17 | FY 12/18 | FY 12/19 |
ROE (%) | 13.1 | 15.5 | 14.5 | 14.3 | 14.8 | 11.8 |
Net Profit to Sales Ratio | 5.25 | 6.77 | 6.53 | 6.94 | 7.56 | 6.86 |
Asset Turnover Ratio (x) | 1.19 | 1.16 | 1.08 | 1.04 | 1.02 | 0.90 |
Leverage (x) | 2.09 | 1.98 | 2.04 | 1.97 | 1.91 | 1.90 |
The ROE in the term ended December 2019 fell below that in the term ended December 2018, but exceeds 8%, which is the ideal goal among Japanese enterprises. In the medium term, the company aims to keep ROE 15% or over.
1-6 Characteristics and strengths
①Broad Customer Base
Takemoto Yohki boasts of an extremely wide range of clients with some 4,400 customers within and outside Japan. In addition, no single client contributes more than 10% of the total sales and the stable cash flow secured from this client base enables continuous investment into molds. Furthermore, the company’s high-quality proposal-based marketing capability contributes to high levels of customer satisfaction and repeat business.
②Bountiful Stock of Molds
As explained earlier, the bountiful stock of 3,569 molds allow Takemoto Yohki to respond flexibly to customers’ needs. In addition, the company is fortifying its product lineup and promoting development of high- added-value- container products with design and functionality taken into consideration. At the same time, efforts are being made to reduce investment burden and risks by standardizing, communizing, and miniaturizing.
③Flexible Product Supply Structure and Production Capabilities
6 bases in Japan and 3 bases overseas (2 in China and 1 in India), the company has recently established a manufacturing affiliate in the Netherlands. Through a production network that cooperates and complements each other, the company has built a global product supply system capable of delivering a large variety of high-quality products quickly and in small lots.
Moreover, new manufacturing technologies are being actively introduced with product cost, strength and quality in mind, in order to respond to customers’ needs for customized products.
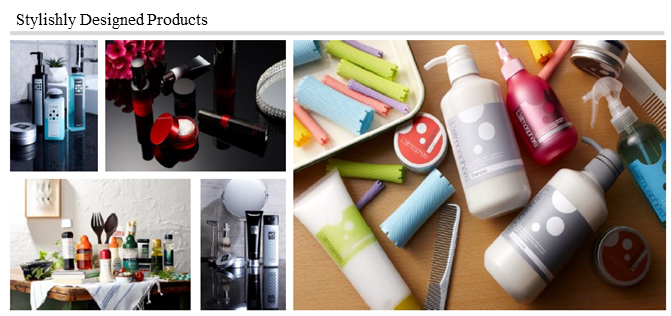
④“High Levels of Development and Proposal-Based Marketing”
The high levels of development and proposal-based marketing capabilities are the source of the sustained increase in corporate value and contribute to the establishment of a wide customer base. Through planning, development and technology about 30 staff endeavor to realize various ideas for products, taking materials, shapes, functionality, and safety into consideration. About 1,000 types of Standard Bottle brand products are on display at the Kappabashi Showroom which reflects the high levels of development and proposal-based marketing capabilities of the company.

(Source: Takemoto Yohki)
By using its Standard Bottle development foundation and its bountiful stock of molds, the company has been offering development proposals to customers while providing them with high-quality original molds with low prices and short delivery times. The company calls such an endeavor "custom bottle innovation" and has been promoting it expansively.
In September 2019, “TOGETHER LAB,” a facility to strengthen the “custom bottle innovation,” was completed in Higashi-Ueno. The official operation is scheduled for April 2020.
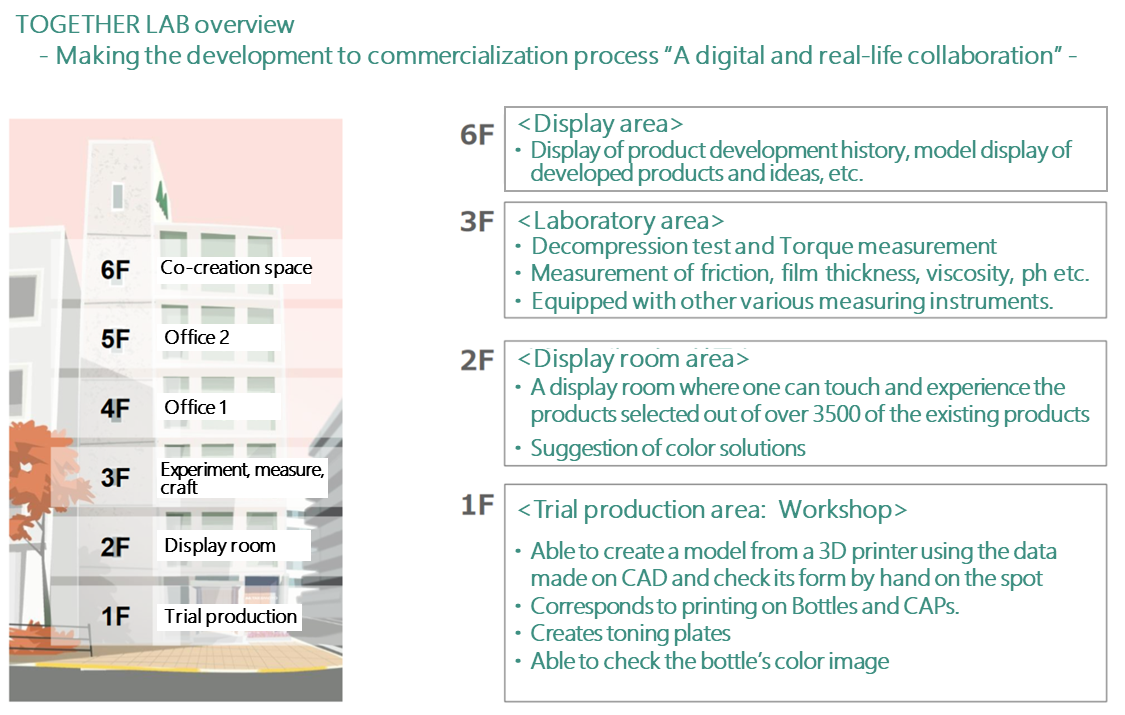
(Source: the company)
At “TOGETHER LAB,” which means collaboration with customers, various simulation images including idea sketches and product display images can be presented through high-quality 3D CAD to customers who come to the LAB.
This enables more efficient and higher quality communication with customers than ever before, making it possible to develop a product in line with customers’ development philosophy.
Up until now, it was necessary to repeat the procedure of listening to clients’ requests and resubmitting revised proposals before commencing product development. This restricted the acceleration of processes, but 3D data are linked to mold designs, so it is possible to shorten product development periods considerably.
The company recognizes “TOGETHER LAB” as a “foothold for co-creation and development,” which is aimed at creating three values,“co-creation value: to create together,” “time value: clients can check products with their eyes and hands on site,” and “convenience value: to have discussions and gather information in Tokyo instead of in a factory.”
(Source: the company)
⑤Four aspects highly evaluated by customers
Based on the above-mentioned “broad and multi-layered customer base,” Takemoto is highly evaluated for its ability to meet customer needs with its high-quality proposal-based marketing capability; abundant mold stock, options for customization, flexible product supply structure and ability to meet production needs.
2.Fiscal Year ended December 2019 Earnings Results
2-1 Earnings Overview
| FY 12/18 | Share | FY 12/19 | Share | YoY | Compared with the initial forecasts | Compared with the revised forecasts |
Sales | 16,022 | 100.0% | 15,196 | 100.0% | -5.2% | -10.3% | -0.0% |
Gross profit | 4,817 | 30.1% | 4,726 | 31.1% | -1.9% | - | - |
SG&A | 3,186 | 19.9% | 3,188 | 21.0% | +0.1% | - | - |
Operating Income | 1,630 | 10.2% | 1,538 | 10.1% | -5.7% | -8.3% | +1.2% |
Ordinary Income | 1,762 | 11.0% | 1,575 | 10.4% | -10.6% | -7.7% | +1.6% |
Net Income | 1,211 | 7.6% | 1,043 | 6.9% | -13.9% | -11.2% | +6.5% |
*Unit: Million yen
The sales both in Japan and abroad were low and resulted in a decrease in sales and profits, falling below the initial estimate.
The sales for the term ended December 2019 were 15,196 million yen, down 5.2% year on year. In Japan, sales fell below the estimate significantly, due to the recoil from the growth of demand for cosmetics in the previous year and the decline of inbound demand. Overseas sales declined from the previous term, falling below the estimate, due to the drop in demand in China caused by the EC regulations, the trade friction between the U.S. and China, etc., and the delay in the launch of new products in new markets.
Operating income was 1,538 million yen, down 5.7% year on year. The procurement of resale materials decreased, and the rise in prices of raw materials was within the scope of assumption, but the company was not able to offset the augmentation of costs, due to the drop in sales.
Capital Investment, Depreciation
| FY 12/18 | FY 12/19 |
Depreciation | 1,021 | 1,077 |
Capital Investment | 1,946 | 1,401 |
Out of which Molds | 476 | 289 |
*Unit: Million Yen
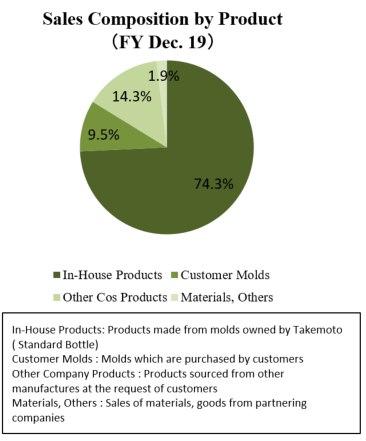
Sales by Product Type
| FY 12/18 | Share | FY 12/19 | Share | YoY |
Products Made by the Company (Standard Bottle) | 11,515 | 71.9% | 11,284 | 74.3% | -2.0% |
Products Made with Molds Paid for/Owned by Customers (Custom Bottle) | 1,636 | 10.2% | 1,444 | 9.5% | -11.7% |
Products Manufactured by Other Companies | 2,532 | 15.8% | 2,175 | 14.3% | -14.1% |
Materials and others | 336 | 2.1% | 291 | 1.9% | -13.4% |
Total | 16,022 | 100.0% | 15,196 | 100.0% | -5.2% |
*Unit: Million Yen
As for standard bottles, the domestic sales of mainly those for cosmetics increased, but the sales in China dropped.
The domestic sales of customized bottles rose, but the sales in China, where large-scale transactions are dominant, declined.
Sales by Field Type
| FY 12/18 | Share | FY 12/19 | Share | YoY |
Cosmetic, beauty | 9,651 | 60.2% | 8,802 | 57.9% | -8.8% |
Sundries, | 697 | 4.4% | 705 | 4.6% | +1.1% |
Foods, health foods | 1,310 | 8.2% | 1,385 | 9.1% | +5.7% |
Chemical and pharmaceuticals | 838 | 5.2% | 812 | 5.3% | -3.1% |
Wholesale, others | 3,523 | 22.0% | 3,490 | 23.0% | -0.9% |
Total | 16,022 | 100.0% | 15,196 | 100.0% | -5.2% |
*Unit: million yen
The sales of products for cosmetics and beauty, which are the mainstay, dropped considerably in both Japan and China.
In the foods and health foods category, sales for real cosmetics grew. Although sales promotion targeting foods was carried out, sales remained at the same level.
Regional Trends
Sales | FY 12/18 | FY 12/19 | YoY | Divergence from Est. |
Japan | 12,063 | 11,741 | -2.7% | -5.6% |
China (JPY base) | 3,921 | 3,438 | -12.3% | -18.3% |
China (RMB base) | 234 | 217 | -7.3% | -17.1% |
Other areas | 322 | 234 | -27.4% | -62.2% |
Operating Income |
|
|
|
|
Japan | 1,242 | 1,277 | +2.8% | +7.0% |
China (JPY base) | 515 | 434 | -15.7% | -25.9% |
China (RMB base) | 30 | 27 | -10.7% | -24.9% |
Other areas | -128 | -178 | - | - |
*Unit: million yen
(Japan)
Sales dropped, falling below the estimate, while profit rose, exceeding the estimate.
Due to the recoil from advanced procurement conducted while seeing the shortage of containers for cosmetics in 2018, the number of repeat orders dropped, and due to the EC regulations enforced in China, the demand for products for foreign customers decreased in the second to fourth quarters.
Through marketing with proposals for development, the sales from new transactions increased, but total sales dropped, falling below the estimate.
As for profit, the sales of products (standard bottles and customized bottles) grew, so gross profit and its rate increased.
It was assumed that the prices of raw materials for plastics would rise 10% from the previous term, but the actual rate of increase was 1.4%.
The increase in gross profit due to the rise in profit rate offset the augmentation of costs for participating in exhibitions, R&D, and logistics. Therefore, operating income grew year on year, exceeding the estimate.
(China)
Sales and profit dropped, falling below the estimates.
Due to the EC regulations enforced in January 2019, the sales toward major clients in China declined, and the sales total toward the U.S. dropped as well. In addition, due to exchange rates, the sales of standard bottles and customized bottles declined.
As for profit, gross profit declined. Although the augmentation of expenses was curtailed, operating profit rate decreased 0.5 points. The costs for procuring raw materials for plastics decreased 50 million yen from the previous term.
(Other areas)
Sales and profit decreased, and they were lower than the targets.
The factory in India started full-scale operation in July 2018, and depreciation of the plant and production machinery began. Molds were also transferred from Japan and China.
The local production consignment system in the Netherlands has already been established. In addition to transferring existing molds, new molds are being produced locally.
In India, the company first received orders for products with clients’ molds, and worked on the production of molds, but sales have not been posted on a full-scale basis. The number of new business partners is increasing, but expenses are being posted first.
In the Netherlands, the company dealt with business inquiries, which increased after exhibitions, but most transactions were small-lot ones, so the company did not use manufacturing outsources, and sales did not reach the estimate. However, they gathered information on environmental issues while educating the locally recruited staff, contributing to the product development of the group companies.
In the U.S., although there were inquiries, the number of large-scale projects in the cosmetics field that contributed in the previous fiscal year decreased, and the sales amount halved.
2-2 Financial Conditions and Cash Flow
Balance Sheet
| End of December 2018 | End of December 2019 |
| End of December 2018 | End of December 2019 |
Current Assets | 8,184 | 8,198 | Current liabilities | 4,689 | 3,609 |
Cash | 3,020 | 3,413 | Payables | 2,593 | 1,929 |
Receivables | 3,422 | 3,096 | LT Interest Bearing Liabilities | 531 | 545 |
Inventories | 1,566 | 1,473 | Taxes Payable | 306 | 162 |
Noncurrent Assets | 8,546 | 8,665 | Noncurrent liabilities | 3,486 | 4,030 |
Tangible Assets | 7,573 | 7,828 | ST Interest Bearing Liabilities | 3,184 | 3,703 |
Buildings and structures (Net Depreciation) | 3,474 | 3,446 | Total Liabilities | 8,175 | 7,639 |
Intangible Assets | 428 | 410 | Net Assets | 8,555 | 9,224 |
Investment, Others | 544 | 426 | Shareholders’ Equity | 8,356 | 9,155 |
Total assets | 16,730 | 16,864 | Total Liabilities and Net Assets | 16,730 | 16,864 |
*Unit: million yen |
|
| Total Interest-bearing Liabilities | 3,716 | 4,248 |
|
|
| Capital Adequacy Ratio | 50.9% | 54.4% |
Total assets grew 133 million yen to 16,864 million yen, due to the increase in tangible assets. Total liabilities dropped 536 million yen to 7,639 million yen, due to the decrease in accounts payable, etc.
Net assets increased 669 million yen to 9,224 million yen, due to the rise in retained earnings.
As a result, capital adequacy ratio rose 3.5% from the end of the previous term and became 54.4%.
Cash Flow
| FY12/18 | FY12/19 | Increase/Decrease |
Operating Cash Flow | 2,028 | 1,790 | -238 |
Investing Cash Flow | -2,194 | -1,635 | +559 |
Free Cash Flow | -165 | 155 | +321 |
Financing Cash Flow | 814 | 287 | -526 |
Term End Cash and Equivalents | 2,860 | 3,264 | +403 |
*Unit: Million Yen
The surplus of operating CF shrank due to the decrease in profit, but the deficit of investing CF decreased due to the decline in expenditures through the acquisition of tangible assets and free CF turned positive.
The revenue from long-term borrowing decreased, and the positive range of financing CF was reduced.
The cash position improved.
2-3 Topics
Progress of mold development
The number of molds of the company is 3,569 as of the end of December 2019.
The molds of the company in India and the Netherlands are carefully manufactured with quality control in accordance with Japanese standards.
| The Number of Completed Molds in FY 12/19 | The Number of Holding Molds in FY 12/19 | In Progress | ||||
Standard | Custom | Total | Standard | Custom | Total | ||
Japan | 76 | 20 | 96 | 2,321 | 38 | 11 | 49 |
China | 60 | 14 | 74 | 1,184 | 46 | 12 | 58 |
India | 14 | 1 | 15 | 45 | 37 | 14 | 51 |
Netherlands | 8 | 2 | 10 | 19 | 17 | - | 17 |
Total | 158 | 37 | 195 | 3,569 | 138 | 37 | 175 |
*Unit: Molds. Standard is standard bottle, custom is custom bottle.
3.Fiscal Year ending December 2020 Earnings Forecasts
3-1 Earnings Estimates
| FY 12/19 | Ratio to sales | FY 12/20 Est. | Ratio to sales | YoY |
Sales | 15,196 | 100.0% | 15,500 | 100.0% | +2.0% |
Operating Income | 1,538 | 10.1% | 1,600 | 10.3% | +4.0% |
Ordinary Income | 1,575 | 10.4% | 1,600 | 10.3% | +1.6% |
Net Income | 1,043 | 6.9% | 1,100 | 7.1% | +5.5% |
*Unit: Million Yen. Estimates are based on the source from the company.
Increase in sales and profits. Review capital investment plan.
Sales are estimated to be 15.5 billion yen, up 2.0% year on year.
The needs for standard bottles are expected to continue growing due to diversification of consumer needs, the shortening of product cycle which demands the reduction of development costs and periods, correspondence to sustainability etc. Performance is projected to be sluggish in the first half of the year, due to the lingering effects of recoil from advanced procurement in 2018. Outside Japan, the full-scale sale in India is expected.
Operating income is forecasted to be 1.6 billion yen, up 4.0% year on year.
Through the revision to the capital investment plan, large-scale investment was put off, so that the augmentation of depreciation will be inhibited. Although the company expects the prices of raw materials to be flat, an increase in demand for recycled resin from customers may lead to an unexpected increase in burden.
Profit is estimated to rise, due to the curtailment of SG&A expenses.
The annual dividend is to be 19.00 yen/share, as the interim and term-end dividends are both 9.50 yen/share like in the previous term. The estimated payout ratio is 21.6%.
The payout ratio is targeted at 20% or more.
3-2 Capital Investment, Depreciation
| FY 12/19 Act. | FY 12/20 Est. | YoY |
Depreciation | 1,077 | 1,140 | +5.8% |
Capital Investment | 1,401 | 1,650 | +17.8% |
Out of which Molds | 289 | 630 | +118.0% |
EBITDA | 1,077 | 1,140 | +5.8% |
*Unit: million yen
(Breakdown of investment)
| Domestic | Share | International | Share | Total | Share |
TOGETHER LAB related | 60 | 3.6% | - | - | 60 | 3.6% |
Machinery equipment (molding machine, multilayer machine, image inspection device, automatic machine, etc.) | 370 | 22.4% | 350 | 21.2% | 720 | 43.6% |
Mold | 270 | 16.4% | 360 | 21.8% | 630 | 38.2% |
Others | 230 | 13.9% | 10 | 0.6% | 240 | 14.5% |
Total | 930 | 56.4% | 720 | 43.6% | 1,650 | 100.0% |
The company plans to invest in capital for the purposes of developing standout containers, enriching the product lineup in overseas markets, improving production efficiency, etc.
4.Regarding the mid-term plan
Considering the changes in the business environment, including the decline in inbound demand, the company revised the mid-term plan (2019-2021) announced in January 2019, and announced the mid-term plan (2020-2022) in January 2020.
(1) Numerical Targets
* Mid-term plan (2019-2021) Numerical targets
| FY 12/19 (Plan) | YoY | FY 12/20 (Plan) | YoY | FY12/21 (Plan) | YoY |
Sales | 16,934 | +5.7% | 17,952 | +6.0% | 19,173 | +6.8% |
Operating Profit | 1,678 | +2.9% | 1,712 | +2.0% | 1,830 | +6.9% |
Operating Profit on Sales | 9.9% | -0.3p | 9.5% | -0.4p | 9.5% | 0.0p |
Ordinary Income | 1,706 | -3.2% | 1,722 | 0.9% | 1,836 | +6.6% |
Net Income | 1,176 | -2.9% | 1,203 | 2.3% | 1,281 | +6.5% |
Depreciation | 1,198 | 17.3% | 1,555 | 29.8% | 1,825 | +17.4% |
Capital Investment | 3,585 | 84.2% | 3,189 | -11.0% | 2,410 | -24.4% |
Out of which Molds | 700 | 47.1% | 759 | 8.4% | 749 | -1.3% |
EBITDA | 2,876 | +8.5% | 3,267 | +13.6% | 3,655 | +11.9% |
* Mid-term plan (2020-2022) Numerical targets
| FY 12/20 (Plan) | YoY | FY 12/21 (Plan) | YoY | FY 12/22 (Plan) | YoY |
Sales | 15,500 | +2.0% | 16,400 | +5.8% | 17,400 | +6.1% |
Operating Profit | 1,600 | +4.0% | 1,750 | +9.4% | 1,850 | +5.7% |
Operating Profit on Sales | 10.3% | +0.2p | 10.7% | +0.3p | 10.6% | +0.0p |
Ordinary Income | 1,600 | +1.6% | 1,750 | +9.4% | 1,850 | +5.7% |
Net Income | 1,100 | +5.5% | 1,200 | +9.1% | 1,275 | +6.3% |
Depreciation | 1,140 | +5.8% | 1,220 | +7.0% | 1,330 | +9.0% |
Capital Investment | 1,650 | +17.8% | 1,600 | -3.0% | 1,850 | +15.6% |
Out of which Molds | 630 | +118.0% | 720 | +14.3% | 550 | -23.6% |
EBITDA | 2,740 | +4.8% | 2,970 | +8.4% | 3,180 | +7.1% |
As of January 2019, it was assumed that (1) demand would grow further from 2018 and the company would enhance its production capacity and (2) new businesses would be launched for coping with environmental issues, etc., but this time, the mid-term plan was formulated based on the following assumptions.
*As for the demand for packaging containers in Japan in 2019, the amount of orders received decreased, especially in the second half of the year, due to the recoil from advanced procurement due to the sense of shortage of containers for cosmetics in 2018 and the drop in demand due to the enactment of EC regulations in China.
*Although the demand for containers is expected to grow gently in 2020, domestic annual sales are estimated to be unchanged from 2019.
*The increase of production footholds will be put off for a while, but the company will continue investment for developing containers for sustainability, enriching the product lineup outside Japan, automation for improving production efficiency, etc.
*In China, there was an inventory adjustment due to the EC regulations in the first half of 2019. Due to the lingering effects of the trade friction between the U.S. and China, the sales in 2020 are estimated to be unchanged from 2019, but the company plans to increase sales in the medium term, by increasing new transactions. To cope with the further growth of demand, the company is thinking of building the third factory in 2022.
*For the markets in the U.S., India, and the Netherlands, the company plans to forge solid footing and earn sales steadily with business transactions for which the company has received inquiries. The company will make efforts to fortify the system for continuously supplying high-quality products in a stable manner.
(Regional plans and key points)
(Japan)
| FY 12/20 (Plan) | YoY | FY 12/21 (Plan) | YoY | FY 12/22 (Plan) | YoY |
Sales | 11,800 | +0.5% | 12,100 | +2.5% | 12,800 | +5.8% |
Operating Profit | 1,300 | +1.8% | 1,270 | -2.3% | 1,450 | +14.2% |
Operating Profit on Sales | 11.0% | +0.1pt | 10.5% | -0.5pt | 11.4% | +0.8pt |
Under the assumption that domestic demand for containers will increase slightly, the company will continue the development of standard bottles with functionality and design for sustainability. In 2021, it is forecasted that sales will rise slightly, but profit will drop due to the augmentation of expenses.
(China)
| FY 12/20 (Plan) | YoY | FY 12/21 (Plan) | YoY | FY 12/22 (Plan) | YoY |
Sales | 3,500 | +1.8% | 3,700 | +5.7% | 3,900 | +5.4% |
Operating Profit | 440 | +1.4% | 480 | +9.1% | 385 | -19.8% |
Operating Profit on Sales | 12.6% | -0.1pt | 13.0% | +0.4pt | 9.9% | -3.1pt |
It is not possible to predict whether or not the trade friction between the U.S. and China will be settled, but the demand in China is expected to expand breaking away from the negative effects of the EC regulations. In 2022, it is assumed that the burden of depreciation will augment through the construction of a new factory and profit will decline.
(Others)
| FY 12/20 (Plan) | YoY | FY 12/21 (Plan) | YoY | FY 12/22 (Plan) | YoY |
Sales | 410 | +75.2% | 780 | +90.2% | 940 | +20.5% |
Operating Profit | -130 | - | 0 | - | 30 | - |
Operating Profit on Sales | - | - | - | - | 3.2% | +3.2pt |
In India, it took time to produce clients’ molds, and the full-scale posting of sales was delayed, but the company enriched the lineup of its molds and conducted marketing focused on standard bottles. The company aims to post operating profit in 2021.
(2) Points of the mid-term plan
The company is pursuing “sustainability,” “strengthening of the development proposal capability,” and “achieving outstanding speed” under the priority theme: “further strengthening of standout features” to “offer outstanding value to customers' products.”
① Sustainability
(The environment surrounding the company)
The EU aims to recycle more than half of the plastic waste in Europe. Regulations in the EU will be implemented from 2021 to ban the use of single-use plastic products throughout the market. Furthermore, 65% of all waste containers and packaging materials will be recycled by 2025, and all plastic containers and packaging materials will be reusable or recyclable in 2030.
Also, Japan has set the following goals under the basic principle "3R + Renewable" in the "Plastic Resource Recycling Strategy."
Reduce | Cumulative 25% regulation in single-use plastics emissions by 2030 |
Recycle and Reuse | Design reusable and recyclable containers by 2025 Recycle and reuse 60% of containers and packaging by 2030 |
Renewable | Double the recycling by 2030 Introduce biomass plastics |
(Corporate measures)
The company is implementing the following actions to realize a recycling economy and a low-carbon society.
Raw materials | Development and sale of biodegradable plastic containers since 1991. The company has been selling standard bottles made of glass, metal, paper, etc. since 1995. Also, it has been selling biomass plastic containers made from plants such as sugarcane since 2014. |
Recycle | In 2005, the company began developing and selling containers that can be used repeatedly, and since 2011, it has been developing and selling containers that use recycled raw materials that include PET and PP. |
Innovation | The company started developing and selling single material containers and thin containers (lightweight) since 2000. Since 2008, the company has been developing and selling containers made of materials that reduce CO2 emissions when incinerated. Since 2013, the company has been developing coating technology to improve the barrier properties of containers. |
Recently, the company has recognized the necessity of building a new supply chain while taking into account the entire product life cycle.
② "Strengthening the development proposal capability" and "Achieving outstanding speed”
“TOGETHER LAB” plays an important role here as described in [1-6 Characteristics and Strengths].
The company is working on a synergy between data and the physical operations based on “TOGETHER LAB,” in cooperation with external experts, securing intellectual property through patents, etc.
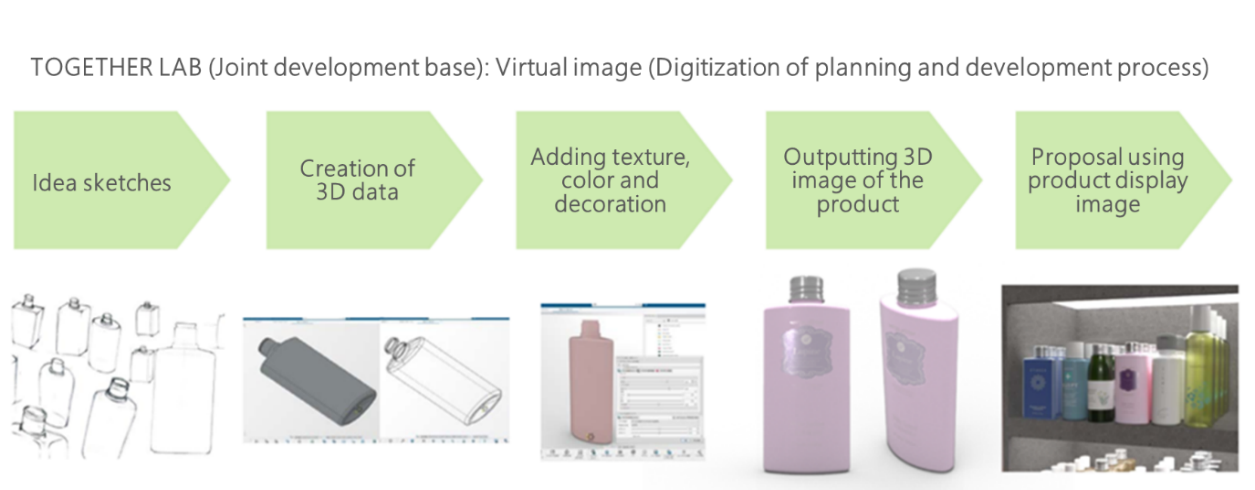
In particular, “Synergy between data and physical operations” is what the company is aiming for to accumulate experience and knowledge and share internal information via open access by utilizing digital tools. “Synergy between data and physical operations” produces many benefits such as “reduction of time from proposal to commercialization,” “digitization of the planning and development process,” “creation of added value by accumulating data and experiments,” “improvement of operating efficiency,” “strengthening responsiveness to overseas clients,” and “utilization of the simulation for design, quality, and production.” The company believes that these benefits will enable it to strengthen competitiveness further through “acceleration,” “response improvement” and “enhanced creativity for added value.”
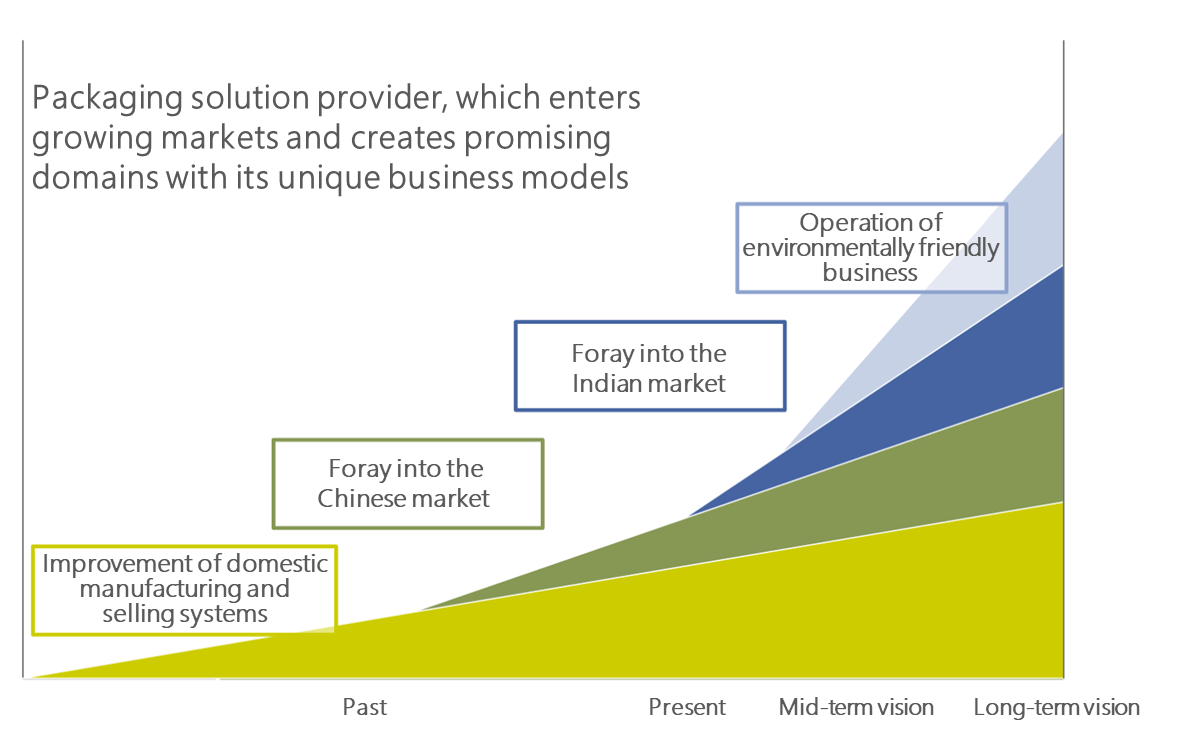
(Future vision)
The company aims for further growth by promoting full deployment in the Chinese and Indian markets and developing eco-friendly
businesses.
5.Conclusions
From a short-term viewpoint, the impact of coronavirus disease (COVID-19) has not been taken into account, and there are concerns over the effects of the shrinkage of inbound demand on the domestic demand, whose expansion rate has been decreasing. From a mid-term viewpoint, we would like to pay attention to the progress of the mid-term plan, in which capital investment has been put off, inside and outside Japan and how “TOGETHER LAB,” which will be put into operation in April, will produce positive effects.
<Reference: Regarding Corporate Governance>
◎ “Organization type”
Organization Structure | Company with audit and supervisory committees |
Directors | 7 directors of whom 4 are outside directors |
◎Corporate Governance Report
Last update date: March 30, 2020.
<Basic policy>
“Creating bottles with our customers’ hearts in mind” is our “corporate motto,” and our mission is ensuring the safety of our customers’ products of various substances and contents and increasing its value and individuality through the provision of packaging containers, which are imperative to people’s daily lives. In order to realize this management philosophy, increase medium- to long-term corporate value, and ensure the soundness and transparency of corporate activities, we will work on enhancing corporate governance in accordance with the following basic policies.
(1) Ensuring shareholders rights and equality
We will promptly disclose information in compliance with relevant laws and regulations to ensure substantial equality for all shareholders and ensure the rights of shareholders.
(2) Appropriate collaboration with stakeholders other than shareholders
In order to increase corporate value over the medium to long term, we will practice appropriate collaboration not only with shareholders but also with stakeholders such as customers, business partners, employees, and local communities. To become a good corporate citizen, the Board of Directors and the management team are complying with laws and regulations, striving to achieve the corporate philosophy and employee code of conduct, and working for fair and clear business operation based on our management philosophy.
(3) Ensuring appropriate information disclosure and transparency
We recognize that proper and accurate information disclosure is imperative for continuing corporate activities with the understanding of various stakeholders. In addition to timely and appropriate disclosure based on laws and regulations, we will proactively disseminate information on the operational status of the Group’s business through our website and business reports.
(4) Responsibilities of the Board of Directors
We recognize that the decision-making function and supervisory function of the Board of Directors need to be effectively utilized in order to control all risks that threaten business continuity and reduce and resolve undesirable events.
We have selected a company with an audit and supervisory committee under the companies act. The audit and supervisory committee, which consists of outside directors, plays a role in management supervision and strives to achieve highly transparent management.
(5) Dialogue with shareholders
We recognize that in order to achieve sustainable growth and in order to strengthen our corporate values it is important to conduct constructive dialogue with shareholders and reflect their opinions and requests with regard to management.
In implementing the capital policy, we ensure proper procedures and provide sufficient explanations to shareholders so as not to unduly harm existing shareholders.
In order for shareholders and investors to gain an understanding of our management strategies and plans, the department in charge of IR plays a central role and provides venues for dialogue.
<Reasons for Non-compliance with the Principles of the Corporate Governance Code (Excerpts)>
Principles | Reasons for not implementing the principles |
[Supplementary Principle 1-2-4 Electronic Exercising of Voting Rights to Shareholder’s Meeting/English Translation of Convocation of Notice] [Supplementary Principle 3-1-2 Disclosure and Provision of Information in English] | Our company made it possible to exercise voting rights via the Internet from the 69th annual meeting of shareholders held in March 2020, and participated in the platform for exercising electronic voting rights, but do not produce convocation notices and financial statements in English. We recognize the necessity to provide information in English for investors outside Japan and establishing an environment in which it is easy to exercise voting rights in accordance with the state of the shareholding structure of corporate investors, etc. In the future, we will consider translating the Convocation of Notice and other documents while taking the ratio of overseas investors in shareholders into account. |
[Supplementary Principle 4-11-3 Evaluating Effectiveness of Board of Directors] | The board of directors will have regular meetings once a month and when deemed necessary will hold adequate meetings to decide and report important matters related to the execution of operations. Moreover, the board of directors will actively discuss issues in managerial strategies, governance and administration, as well as exchange opinions on the management situation of the board of directors. However, the Board of Directors’ effectiveness has yet to be evaluated. |
<Disclosure Based on the Principles of the Corporate Governance Code (Excerpts)>
Principles | Disclosure contents |
[Principle 1-4 So-called strategically held shares] | Our company will retain shares of clients if we conclude that building a stable and long-term business relationship or collaborating would contribute to improving the mid- to long-term value of our company. Currently, strategically held shares account for less than 0.1% of the company’s total assets, so the financial impact is extremely low. The strategically held shares, which place high importance in funds, are being examined by the Board of Directors to determine the necessity and the sense in continuing to retain them. As for shares that have begun to lose their strategic importance, we will open dialogues with our business partners and work to reduce the number of such shares. In terms of exercising voting rights on them, judgment on the vote will be made from the perspective of whether it will contribute to improving the mid- to long-term value of said company and our company. |
This report is intended solely for information purposes, and, it is not intended as a solicitation to invest in the shares of this company. The information and opinions contained within this report are based on data made publicly available by the company, and they come from sources that we consider to be reliable. However, we cannot guarantee the accuracy or completeness of the data. This report is not a guarantee of the accuracy, completeness or validity of said information and/or opinions, nor do we bear any responsibility for the same. All rights pertaining to this report belong to Investment Bridge Co., Ltd., which may change the contents thereof at any time without prior notice. All investment decisions are the responsibility of the individual and should be made only after proper consideration. Copyright(C) 2020, Investment Bridge Co., Ltd. All Rights Reserved. |