Bridge Report:(4312)Cybernet Systems the second quarter of Fiscal Year December 2019
![]()
 Reiko Yasue, President & CEO | Cybernet Systems Co., Ltd. (4312) |
|
Company Information
Market | TSE 1st Section |
Industry | Information and communications |
President | Reiko Yasue, |
HQ Address | FUJISOFT Bldg. 3 Kanda-neribeicho, Chiyoda-ku, Tokyo |
Year-end | December |
Homepage |
Stock Information
Share Price | Number of shares issued (excluding treasury shares) | Total market cap | ROE(Act.) | Trading Unit | |
¥610 | 31,158,269shares | ¥19,007milion | - | 100shares | |
DPS(Est.) | Dividend yield (Est.) | EPS(Est.) | PER(Est.) | BPS(Act.) | PBR(Act.) |
¥15.38 | 2.5% | ¥30.75 | 19.8x | ¥408.80 | 1.5x |
*The share price is the closing price on August 15. The number of shares issued was calculated by subtracting the treasury shares from the number of outstanding shares at the end of the latest quarter. ROE and BPS are from the last year-end.
Consolidated Earnings
Fiscal Year | Net Sales | Operating Income | Ordinary Income | profit attributable to owners of parent | EPS (¥) | DPS (¥) |
December 2015(Act.) | 15,518 | 851 | 1,003 | 463 | 14.87 | 13.80 |
December 2016(Act.) | 16,031 | 1,027 | 1,001 | 462 | 14.83 | 13.00 |
December 2017(Act.) | 17,987 | 1,504 | 1,639 | 937 | 30.09 | 15.05 |
December 2018(Act.) | 19,719 | 1,502 | 1,684 | -656 | -21.07 | 16.52 |
December 2019(Est.) | 20,000 | 1,520 | 1,608 | 958 | 30.75 | 15.38 |
*(Unit: ¥mn)
This Bridge Report presents Cybernet Systems’s second quarter of fiscal year December 2019 earnings results, and fiscal year December 2019 earnings forecasts, etc.
Table of Contents
Key Points
1.Company Overview
2.Second Quarter of Fiscal Year December 2019 Earnings Results
3.Fiscal Year ending December 2019 Earnings Forecasts
4.Conclusions
Reference: Regarding Corporate Governance
Key point
- In the second quarter (cumulative) of the fiscal year 2019, sales and operating income grew 9.8% and 55.0% year on year, respectively. Sales increased in all business segments including an increase of 25.0% year on year in transportation equipment, driven by active development investment related to automobiles with the keywords such as CASE (connected, automation, sharing, electrification) and ADAS (advanced driver assistance system). In addition to the increase in sales, the sales composition improved and the amortization of goodwill declined. As a result, the operating income margin improved 4.0 points to 13.8%.
- For the full-year forecasts, sales and operating income are expected to rise 1.4% and 1.2% year on year, respectively. Although sales and profit in the first half exceeded the full-year estimates, the company did not modify the business performance forecasts because of uncertainty about the future of the subsidiaries in China and South Korea in consideration of the issues between the U.S. and China as well as Japan and South Korea, concerns about yen appreciation, direction of corporate performance, and spending of unused allocated budgets that were scheduled to be used in the first half. The year-end dividend is to be 7.69 yen per share. The full-term dividend is to be 15.38 yen per share, including the interim dividend of 7.69 yen.
- Cybernet started the sales headquarters system at the beginning of the term. Up until the previous fiscal year, the business headquarters system was in place, but by changing it to the sales headquarters system suitable for account sales, a new system was established to propose and provide a wide range of products and services to the account in charge. This has already led to the strong results in the second quarter. Although the company is still cautious about the second half results, it is expected that active R&D will continue in the second half and beyond, especially in the automotive sector. According to the company, the full-year forecasts are formulated with high certainty taking into account various risks at the time of planning. At this moment, the company did not modify the business forecasts due to high uncertainty. We would like to pay attention to how much they can surpass the initial forecasts.
1. Company Overview
With “Computer Aided Engineering (CAE) Solution” and “IT Solution” as two pillars of the business, Cybernet supports the manufacturing of goods, “Monozukuri.” CAE includes virtual designing and experimentation (simulation) on a computer. In the process of product development, CAE helps achieve high quality, shorten the development period, and reduce development cost. It is also environmentally friendly as it reduces waste materials generated by trial production. The Company is engaged in a license sales and maintenance service of more than 50 kinds of globally recognized software provided by more than 20 companies as well as an agency service to approximately 2,000 companies in the fields of automobiles, machinery, electric machinery and 500 research institutions and universities.
The Group is composed of the Company and its 14 consolidated subsidiaries. Its business is operated in North America, the UK, France, Germany, Belgium, and Asia. Among the main consolidated subsidiaries, there are 3 development subsidiaries: Sigmetrix, L.L.C., (US) (calculation of the permissible range of variation in a dimension set at the time of design), which develops and sells tolerance analysis (the permissible range of variation in a dimension set at the time of design) software with technical support; Waterloo Maple Inc., (Canada) for formula manipulation systems; and Noesis Solutions NV, (Belgium), which develops and sells the Process Integration and Design Optimization (PIDO) tools with technical support. The Group also has 4 distributor subsidiaries of CAE Solutions: CYBERNET SYSTEMS (SHANGHAI) CO., LTD. (China), CYBERNET SYSTEMS TAIWAN CO., LTD., (Taiwan, 57% ownership), CYFEM Inc., (South Korea, 65% ownership), and CYBERNET SYSTEMS MALYSIA SDN. BHD. (Malaysia).
Corporate Philosophy
Cybernet’s corporate philosophy is “We will contribute to the advancement of our customers and society by providing solutions that generate high satisfaction through enhanced value-added and high-quality services.” With its corporate message of “Energy for your Innovation,” Cybernet aims to become the “First Contact Company” for customers, that always walks with them and that they trust.
1-1 Business Description
Cybernet’s business is divided into CAE Solution Services providing CAE solutions and related technical services, and IT Solution Services providing IT solutions centered on security-related solutions. CAE Solution Services account for over 80% of the entire business of the Group.
CAE Solution Services
Distributor Business and Vendor Business, both of which sell CAE software and hardware for analysis and simulation in conjunction with a Computer Aided Design (CAD) system, CAE Solution Services manage Consulting Business, design of electronic circuits and boards, model-based development (MBD, to be described later), engineering (consignment) services such as PIDO, and user education and support services such as holding seminars, user conferences, and case presentations.
CAE application areas
MCAE (Mechanical CAE) | After completing the designing process using CAD, it provides software and services that support analysis of structure, heat transfer, electromagnetic, and thermal fluid. The main product is the multi-physics (multiple physical forces) analysis tool “ANSYS,” a product of ANSYS, Inc. (U.S.) |
Optical Design
| It provides optical analysis such as lens design, illumination analysis, optical communication system analysis and measurement tools related to organic EL and optical member characteristics, and solutions and services. Main products include “CODE V” (optical design evaluation program) and “LightTools” (analytical software for lighting design) manufactured by Synopsys, Inc. (U.S.) |
MBD (Model Based Development) | MBD is a design methodology that implements a development process of plan, design, and verification based on formula models. Main products include the STEM computing platform “Maple” and the system-level modeling and simulation tool “MapleSim” ,both of which are provided by the Canadian subsidiary. |
Other fields | The 3D tolerance management tool (cost and quality optimization based on the assembly part dimension of the evaluation object and evaluation on variation of part) which is a product of the U.S. subsidiary and optimized design support tools (analysis automation, robust control/reliability evaluation, application of quality engineering, etc.) by the Belgian subsidiary. |
Development subsidiaries
The 3 development subsidiaries are Sigmetrix, L.L.C. (US), which develops, sells and provides technical support for the 3D tolerance analysis software “CETOL 6σ;” Waterloo Maple Inc. (Canada), which develops, sells and provides technical support for the formula manipulation software “Maple” to formulate (visualize) various physical phenomena and 1D CAE software “MapleSim;” and Noesis Solutions NV (Belgium), which develops, sells and provides technical support for “Optimus” for Process Integration and Design Optimization (PIDO).
Sales subsidiaries
The 4 sales subsidiaries are CYBERNET SYSTEMS TAIWAN CO., LTD. (Taiwan), CYBERNET SYSTEMS (SHANGHAI) CO., LTD. (China), CYFEM Inc. (Korea), of CAE Solutions and CYBERNET SYSTEMS MALAYSIA SDN. BHD. (Malaysia), which was established in November 2018.
IT Solution Services
IT Solution Services offer security related solutions centered on Symantec’s endpoint security products that prevent computer virus infections and information leaks in the servers and client PCs, IT asset management solutions (multiple sales of major products) including “SKYSEA Client View” (SKY Inc.) and “QND Advance” (Quality Software Inc.), and cloud-based single sign-on/access control (IDaaS) solutions using IDaaS (Cloud ID Management) product “OneLogin.”
2.Second Quarter of Fiscal Year December 2019 Earnings Results
2-1 2Q Consolidated results (cumulative)
| 2Q FY 12/18 (cumulative) | Ratio to sales | 2Q FY 12/19 (cumulative) | Ratio to sales | YoY | Forecast | Compared with The initial forecasts |
Sales | 10,748 | 100.0% | 11,798 | 100.0% | +9.8% | 10,784 | +9.4% |
Gross profit | 4,251 | 39.6% | 4,734 | 40.1% | +11.4% | - | - |
SG&A expenses | 3,203 | 29.8% | 3,109 | 26.4% | -2.9% | - | - |
Operating Income | 1,048 | 9.8% | 1,624 | 13.8% | +55.0% | 1,051 | +54.6% |
Ordinary Income | 1,130 | 10.5% | 1,657 | 14.0% | +46.6% | 1,097 | +51.1% |
Net Income | 953 | 8.9% | 1,049 | 8.9% | +10.1% | 675 | +55.4% |
*Unit: ¥mn
Operating income increased 55.0% year on year due to active development investment related to automobiles such as CASE and ADAS
Sales increased 9.8% year on year to 11,798 million yen. The sales increase was observed in all business segments including an increase of 25.0% year on year in transportation equipment, driven by active development investment related to automobiles such as CASE (connected, automation, sharing, electrification) and ADAS (advanced driver assistance system).
Revenue increased 1,050 million on a value basis. The company’s individual CAE solutions increased 447 million yen, and IT solutions increased 501 million yen. Four sales subsidiaries in Asia (China, Taiwan, South Korea, Malaysia) also made use of good relationships with vendors, and sales increased 170 million yen mainly for ANSYS and Synopsys products. On the other hand, sales of three development subsidiaries in Europe and North America (Canada, US and Belgium) declined 67 million yen. The U.S. subsidiary and the Belgian subsidiary are in the stage of upfront investment (focusing on product development), while the Canadian subsidiary has sold its unprofitable businesses and is in the process of business restructuring.
Operating income increased 55.0% year on year to 1,624 million yen. SG&A expenses decreased due to a decline in goodwill amortization expenses (recording of impairment loss in the previous fiscal year) while the gross profit margin improved by 0.5 points due to the improved sales composition. However, because of the reaction to the recording of a gain of 494 million yen in business transfer as extraordinary income in the same period of the previous year, net income was 1,049 million yen, an increase of 10.1% year on year.
Operating income increased 576 million yen on a value basis. The company’s individual CAE solutions grew 443 million yen and IT solutions increased 120 million yen. Furthermore, the profit of four sales subsidiaries grew 24 million yen. The profit of the three development subsidiaries increased 203 million due to the sale of the unprofitable businesses of the Canadian subsidiary (while the company-wide expenses increased 214 million yen).
Net Sales by Category of Industry (non-consolidated)
| 2Q FY 12/18 (cumulative) | Component ratio | 2Q FY 12/19 (cumulative) | Component ratio | YoY |
Electrical equipment | 2,790 | 31.7% | 2,998 | 30.7% | +7.5% |
Machinery & Precision Machinery | 1,423 | 16.2% | 1,486 | 15.2% | +4.5% |
Transportation equipment | 1,143 | 13.0% | 1,430 | 14.7% | +25.0% |
Other manufacturing industry | 1,048 | 11.9% | 1,170 | 12.0% | +11.6% |
Education institution/government and municipal offices | 727 | 8.3% | 803 | 8.2% | +10.4% |
Information and Communications | 518 | 5.9% | 603 | 6.2% | +16.5% |
Others | 1,139 | 13.0% | 1,261 | 12.9% | +10.8% |
Total | 8,790 | 100.0% | 9,754 | 100.0% | +11.0% |
*Unit: ¥mn
Composition Ratio of Net Sales for 2Q FY 2018 (Consolidated)
By business | FY 12/18 | FY 12/19 |
| By sales form | FY 12/18 | FY 12/19 |
| By region | FY 12/18 | FY 12/19 |
CAE | 85.4% | 82.5% |
| Distributor | 74.9% | 75.7% |
| Japan | 81.6% | 81.4% |
IT | 14.6% | 17.5% |
| Vender (in-house) | 13.8% | 13.5% |
| North America | 5.8% | 6.3% |
|
|
|
| Service | 11.3% | 10.8% |
| Asia | 8.7% | 9.7% |
|
|
|
|
|
|
|
| Europe | 3.7% | 2.4% |
|
|
|
|
|
|
|
| Others | 0.3% | 0.3% |
Trend by segment
| 2Q FY Dec. 18 (cumulative) | Composition Ratio /Profit Margin | 2Q FY Dec. 19 (cumulative) | Composition Ratio /Profit Margin | YoY |
CAE Solution Services | 9,182 | 85.4% | 9,732 | 82.5% | +6.0% |
IT Solution Services | 1,565 | 14.6% | 2,066 | 17.5% | +32.0% |
Consolidated sales | 10,748 | - | 11,798 | - | +9.8% |
CAE Solution Services | 1,515 | 16.5% | 2,186 | 22.5% | +44.3% |
IT Solution Services | 83 | 5.3% | 204 | 9.9% | +143.6% |
Adjustments | -550 | - | -765 | - | - |
Consolidated operating income (Operating income margin) | 1,048 | 9.8% | 1,624 | 13.8% | +55.0% |
*Unit: ¥mn
CAE Solution Services
Sales of new licenses and maintenance contract renewals increased mainly for the mainstay product, multi-physics analysis tool “ANSYS.” Sales of engineering services also increased in the business related to MBD/MBSE such as automatic driving and control system design for the automobile industry. As for the subsidiaries, sales of the sales subsidiaries increased, while sales of the development subsidiaries decreased.
IT Solution Services
While the annual renewal of licenses for security-related solutions and the renewal of IT asset management (multiple sales of main products) solutions are progressing, new sales of cloud-based single sign-on/access control solutions increased.
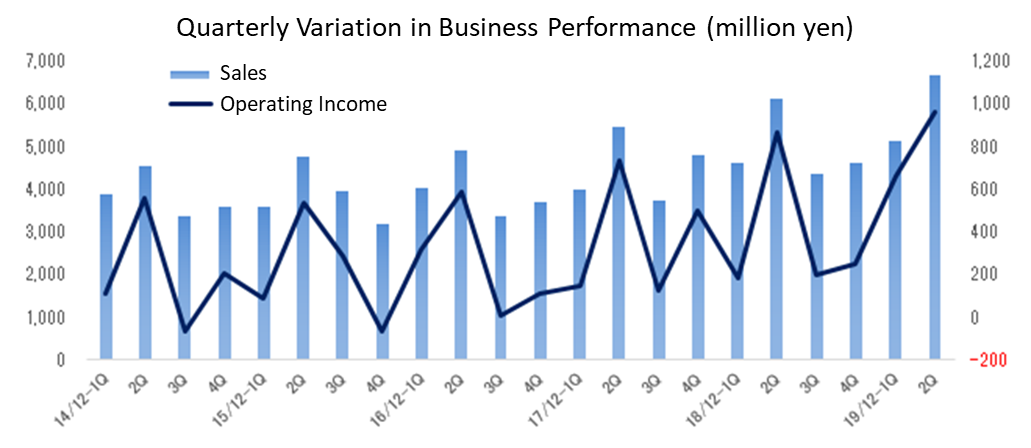
2-2 2Q Consolidated results (April to June)
| 18/12-1Q | 2Q | 3Q | 4Q | 19/12-1Q | 2Q | YoY |
Sales | 4,612 | 6,135 | 4,349 | 4,621 | 5,140 | 6,658 | +8.5% |
Gross profit | 1,764 | 2,486 | 1,750 | 1,903 | 2,097 | 2,636 | +6.0% |
SG & A expenses | 1,583 | 1,619 | 1,547 | 1,651 | 1,433 | 1,675 | +3.5% |
Operating Income | 181 | 867 | 202 | 252 | 664 | 960 | +10.8% |
Ordinary Income | 248 | 882 | 208 | 345 | 680 | 976 | +10.8% |
Net Income | 125 | 827 | -2,032 | 422 | 406 | 642 | -22.3% |
Gross profit margin | 38.3% | 40.5% | 40.2% | 41.2% | 40.8% | 39.6% |
|
SG&A ratio | 34.3% | 26.4% | 35.6% | 35.7% | 27.9% | 25.2% |
|
*Unit: ¥mn
In the second quarter (April-June), both sales and operating income grew 8.5% and 10.8% year on year, respectively.
In addition to the increase in the sales of electrical equipment and transportation equipment including engineering, the sales in the fields of information and communications also grew thanks to the annual license renewal of security-related solutions.
Net Sales by Category of Industry
| 18/12-1Q | 2Q | 3Q | 4Q | 19/12-1Q | 2Q | YoY |
Electrical equipment | 931 | 1,858 | 924 | 965 | 956 | 2,042 | +9.9% |
Machinery & Precision Machinery | 625 | 797 | 468 | 527 | 647 | 839 | +5.2% |
Transportation equipment | 625 | 518 | 491 | 660 | 799 | 630 | +21.7% |
Other manufacturing industry | 420 | 628 | 449 | 515 | 508 | 662 | +5.4% |
Education institution/government and municipal offices | 255 | 472 | 380 | 249 | 331 | 471 | -0.0% |
Information and Communications | 233 | 284 | 172 | 185 | 254 | 349 | +22.8% |
Others | 538 | 600 | 461 | 486 | 566 | 695 | +15.8% |
Total | 3,630 | 5,160 | 3,348 | 3,590 | 4,063 | 5,691 | +10.3% |
*Unit: ¥mn
2-3 Balance Sheet and Cash Flow Statement
Balance sheet
| December 2018 | June 2019 |
| December 2018 | June 2019 |
Cash and deposits | 4,467 | 2,951 | Trade payables | 1,391 | 1,687 |
Trade receivables | 4,570 | 5,025 | Advance received | 1,995 | 2,121 |
Securities | 4,000 | 7,000 | Current liabilities | 4,972 | 5,716 |
Short-term loan receivable | 3,086 | 2,981 | Net defined benefit liability | 1,327 | 1,311 |
Current assets | 17,440 | 18,934 | Liabilities | 1,375 | 1,344 |
Intangible assets | 322 | 285 | Net assets | 12,867 | 13,617 |
Investments, others | 1,153 | 1,127 | Total liabilities, net assets | 19,215 | 20,678 |
Noncurrent assets | 1,775 | 1,744 | Total interest-bearing liabilities | - | - |
*Unit: ¥mn
Total assets at the end of the second quarter increased 1,463 million yen from the end of the previous fiscal year to 20,678 million yen. Equity ratio is 65.1% (66.3% at the end of the previous fiscal year).
Cash flow statement
| 2Q FY Dec. 18 (cumulative) | 2Q FY Dec. 19 (cumulative) | YoY | |
Operating Cash Flow (A) | 169 | 1,792 | +1,623 | +960.4% |
Investing Cash Flow (B) | -237 | 19 | +256 | - |
Financing Cash Flow | -68 | 1,811 | +1,879 | - |
Cash, Equivalents at the end of term | -263 | -271 | -8 | - |
*Unit: ¥mn
Operating CF increased to 1,792 million yen from 169 million yen in the same period last year due to an increase in net income before income taxes and others. Investing CF secured a surplus of 19 million yen due to an increase in collection of loans receivable. As for financing CF, dividend payments increased.
3. Fiscal Year Ending December 2019 Earnings Forecasts
3-1 Consolidated Earnings
| FY Dec. 18 Act. | Composition Ratio | FY Dec. 19 Est. | Composition Ratio | YoY |
Sales | 19,719 | 100.0% | 20,000 | 100.0% | +1.4% |
Operating Income | 1,502 | 7.6% | 1,520 | 7.6% | +1.2% |
Ordinary Income | 1,684 | 8.5% | 1,608 | 8.0% | -4.6% |
Net Income | -656 | - | 958 | 4.8% | - |
*Unit: ¥mn
Sales is estimated to increase by 1.4% year on year and operating income is estimated to increase by 1.2% year on year.
Although the profit for the first half exceeded the full-year forecasts, the company decided not to modify the initial business forecasts. This is because, according to the company, “R&D investment in the manufacturing industry, which is the Group’s main customer, is expected to remain strong because of intensifying competition for development using advanced technologies, etc. However, the outlook for the global economy is becoming more uncertain due to the slowdown of the Chinese market caused by the U.S.-China trade friction and concerns on the economy in South Korea. This uncertainty is affecting the Group’s sales forecast. In addition, we decided to spend the allocated budget for investment that was scheduled for use in the first half in the second half.”
The company will pay interim and term-end dividends of 7.69 yen/share each, for a total annual dividend of 15.38 yen/share (payout ratio : 50%).
4. Conclusion
The company started the sales headquarters system at the beginning of the term. Up until the previous fiscal year, the business headquarters system was in place, but by changing it to a sales headquarters system suitable for account sales, a system was established to enable the company to propose and provide a wide range of products and services to the account in charge. This has already led to the strong 2Q results. The company did not modify the full-year forecasts due to uncertainty about the future of the subsidiaries in China and South Korea associated with issues between the U.S. and China as well as Japan and South Korea, concerns about yen appreciation, direction of corporate performance, and spending of unused allocated budgets that were scheduled to be used in the first half. As a result, the outlook for the second half (difference between the full-year forecasts and the first half results) seemed strange, but the company expects that R&D will continue to be active mainly in the automotive sector from the second half and beyond. According to the company, the full-year forecasts are formulated with high certainty taking into account various risks at the time of planning. Not modifying the full-year forecasts does not mean that there are significant concerns in the second half of the year. Rather, at this moment, the forecasts remained unchanged because of high uncertainty. The author believes that full-year operating income will exceed 2 billion yen, but it is also true that the company’s performance has fluctuated quarterly over the past few years. We would like to pay attention to how much they can surpass the initial forecasts.
Looking ahead, the company said that there is a lot of room for new development not only with primary contracting companies that supply parts directly to automobile manufacturers, but also with secondary and tertiary contracting companies. However, since these companies are often based in the suburbs, the cooperation with partners and agents is essential for business efficiency. For this reason, the company intends to work on the establishment of sales networks in the suburbs. Because the company’s products are highly specialized and require continuous support rather than simply selling out, the quality of partners and agencies is a key point in establishing the sales network.
Reference: Regarding Corporate Governance
◎ Organization type, and the composition of directors and auditors
Organization type | Company with audit and supervisory board |
Directors | 7 directors, including 2 outside ones |
Auditors | 3 auditors, including 2 outside ones |
◎ Corporate Governance Report:The Latest Update : August 8, 2019
Basic Policy
Our company will thoroughly observe all applicable laws and regulations in all corporate activities and take actions that conform to social ethics as we have set forth in the “Cybernet Group Compliance Policy Guidelines” (hereinafter referred to as “Cybernet Policy Guidelines”). This is our basic attitude towards all shareholders. In addition, we respect the Cybernet Policy Guidelines as our company’s basic policy in regard to corporate governance and we strive to ensure the soundness of our management, clarify accountability, and disclose impartial and timely information. We are also aiming to expedite management decisions and improve supervisory functions of business execution, as well as endeavoring to create organizations with effective risk management and screening functions.
<Reasons for Non-compliance with the Principles of the Corporate Governance Code>
We have implemented all the principles of corporate governance code.
<Disclosure Based on the Principles of the Corporate Governance Code (Excerpts)>
[Principle 4-9 Independence criteria and qualities of independent external directors]
When selecting candidates for independent external directors, the Company determines that it lacks independence if it falls under any of the following items. The person selected is someone who does not fall under any of the items below, is not likely to have a conflict of interest with general shareholders, and can be substantially secured independence.
(1) Person who has been a business executor of the Company or its subsidiary within the last 10 years or his/her relative within the second degree of kinship
(2) Person who falls under any of the following, or who were his/her relatives within their second degree, within 1 year
a. An executive of a company that has an important business relationship with the Company or an executive of its parent company or an important subsidiary
b. A lawyer, consultant, etc. of the Company or its subsidiaries who receives a large amount of compensation or other property benefits in addition to the remuneration for the Director from the Company
If it is a corporation/organization, or the like, the person executing the business of the corporation/organization
c. An executive of the Company’s parent company
d. An executive of a company that belongs to the parent company group of the Company
(3) Any other person who may have a constant and substantial conflict of interest with the general shareholders of the Company for reasons other than those considered in (1) and (2) above.
Principle 5-1 Policy on constructive interaction with shareholders
The Company has established a department in charge of IR, and the director in charge of that department is working as the director in charge of the administrative department to design an organic collaboration within the administration department. In addition, the department will report IR activity to the representative director or director in charge once a quarter. Furthermore, regarding the management of insider information, please refer to the following “V.2 (3) Disclosure Policy” and the “Information Disclosure Standard (Disclosure Policy)” listed on our website via the URL below.
(Information Disclosure Standard (Disclosure Policy))
https://www.cybernet.jp/ir/ir_policy/standard/
The Company’s main IR activities are as follows:
1) Financial results briefing (once a year)
2) Medium-Term Business Plan briefing (once a year)
3) General shareholders meeting (once a year)
(4) Individual interviews for institutional investors
(5) Provision of information by e-mail
This report is intended solely for information purposes, and is not intended as a solicitation for investment. The information and opinions contained within this report are made by our company based on data made publicly available, and the information within this report comes from sources that we judge to be reliable. However, we cannot wholly guarantee the accuracy or completeness of the data. This report is not a guarantee of the accuracy, completeness or validity of said information and opinions, nor do we bear any responsibility for the same. All rights pertaining to this report belong to Investment Bridge Co., Ltd., which may change the contents thereof at any time without prior notice. All investment decisions are the responsibility of the individual and should be made only after proper consideration. Copyright(C) 2019 Investment Bridge Co., Ltd. All Rights Reserved. |
To view back numbers of Bridge Reports on Cybernet Systems Co., Ltd. (4312) and other companies, or IR related seminars of Bridge Salon, please go to our website at the following URL.
URL : https://www.bridge-salon.jp/