Bridge Report:(4312)Cybernet Systems the fiscal year December 2019
![]()
 Reiko Yasue, President & CEO | Cybernet Systems Co., Ltd. (4312) |
|
Company Information
Company | TSE 1st Section |
Industry | Information and communications |
President | Reiko Yasue |
HQ Address | FUJISOFT Bldg. 3 Kanda-neribeicho, Chiyoda-ku, Tokyo |
Year-end | December |
Homepage |
Stock Information
Share Price | Number of shares issued (excluding treasury shares) | Total market cap | ROE(Act.) | Trading Unit | |
¥476 | 31,158,221 shares | ¥14,831milion | 9.6% | 100 shares | |
DPS(Est.) | Dividend yield (Est.) | EPS(Est.) | PER(Est.) | BPS(Act.) | PBR(Act.) |
¥20.86 | 4.4% | ¥41.72 | 11.4 x | ¥432.12 | 1.1 x |
*The share price is the closing price on March 13. The number of shares issued was calculated by subtracting the treasury shares from the number of outstanding shares at the end of the latest quarter. ROE and BPS are from the last year-end.
Consolidated Earnings
Fiscal Year | Net Sales | Operating Income | Ordinary Income | Profit attributable to owners of parent | EPS (¥) | DPS (¥) |
December 2016(Act.) | 16,031 | 1,027 | 1,001 | 462 | 14.83 | 13.00 |
December 2017(Act.) | 17,987 | 1,504 | 1,639 | 937 | 30.09 | 15.05 |
December 2018(Act.) | 19,719 | 1,502 | 1,684 | -656 | -21.07 | 16.52 |
December 2019(Act.) | 21,350 | 2,020 | 2,145 | 1,258 | 40.38 | 20.19 |
December 2020(Est.) | 22,000 | 2,060 | 2,140 | 1,300 | 41.72 | 20.86 |
* Forecast is company forecast. Unit: ¥mn
This bridge report shows the results of Cybernet System's financial results for fiscal year ended December 2019, and forecasts for the fiscal year ending December 2020.
Table of Contents
Key Points
1.Company Overview
2.Fiscal Year Ended December 2019 Earnings Results
3.Fiscal Year Ending December 2020 Earnings Forecasts
4.Conclusions
<Reference: Regarding Corporate Governance>
Key points
- In the fiscal year 2019, sales and operating income grew 8.3% and 34.5% year on year, respectively. Unconsolidated sales increased 8.9% year on year led by the business targeting transportation equipment and electric machinery industries. Also, sales from subsidiaries, such as development subsidiaries in the United States and sales subsidiaries in Asia, etc., were strong. SG&A expenses increased only slightly despite an increase in costs due to business expansion because there was no recording of goodwill amortization. As a result, the operating income margin improved from 1.9 points to 9.5%. Sales and operating income are expected to be 6.8% and 32.9%, respectively, both higher than the initial forecast.
- For the fiscal year 2020, both sales and operating income are estimated to increase by 3.0% and 2.0 % year on year, respectively. The impact of the COVID-19 outbreak on the business is not factored in the unconsolidated estimates, but the forecast is conservative, taking account of risks. Based on the basic policy of the Medium-Term Business Plan, the company will rebuild the Group’s governance system and strengthen business management. It will also actively invest in the fields of CAE solutions, AI and security and strengthen overseas sales operations including ASEAN. The company will pay an interim dividend of 10.43 yen and a term-end dividend of 10.43 yen, for a total annual dividend of 20.86 yen (payout rati 50%).
- The estimates for the fiscal year 2020 are conservative. What is required of earnings forecast is accuracy, and does not mean “it is ok as long as they do not downturn.” However, conservative estimates are unavoidable given the future economic uncertainties. To avoid misleading investors, we would like to pay attention to how much the company can add to the initial estimates while expecting a detailed explanation of trends of each industry and technology trends, etc.
1. Company Overview
With “Computer Aided Engineering (CAE) Solution” and “IT Solution” as two pillars of the business, Cybernet supports the manufacturing of goods, “Monozukuri.” CAE includes virtual designing and experimentation (simulation) on a computer. In the process of product development, CAE helps achieve high quality, shorten the development period, and reduce development cost. It is also environmentally friendly as it reduces waste materials generated by trial production. The Company is engaged in a license sales and maintenance service of more than 50 kinds of globally recognized software provided by more than 20 companies as well as an agency service to approximately 2,000 companies in the fields of automobiles, machinery, electric machinery and 500 research institutions and universities.
The company has formed a corporate group with 15 consolidated subsidiaries and operates the businesses in North America, the UK, France, Germany, Belgium, and Asia. Also, it owns 53.9% of the voting rights of FUJI SOFT INCORPORATED, which is listed on the First Section of the Tokyo Stock Exchange.
Corporate Philosophy
Cybernet’s corporate philosophy is “We will contribute to the advancement of our customers and society by providing solutions that generate high satisfaction through enhanced value-added and high-quality services.” With its corporate message of “Energy for your Innovation,” Cybernet aims to become the “First Contact Company” for customers, that always walks with them and that they trust.
1-1 Business Description
Cybernet’s business is divided into CAE Solution Services providing CAE solutions and related technical services, and IT Solution Services providing IT solutions centered on security-related solutions. CAE Solution Services account for over 80% of the entire business of the Group.
CAE Solution Services
Distributor Business and Vendor Business, both of which sell CAE software and hardware for analysis and simulation in conjunction with a Computer Aided Design (CAD) system, CAE Solution Services manage Consulting Business, design of electronic circuits and boards, model-based development (MBD, to be described later), engineering (consignment) services such as PIDO, and user education and support services such as holding seminars, user conferences, and case presentations.
CAE application areas
MCAE (Mechanical CAE) | After completing the designing process using CAD, it provides software and services that support analysis of structure, heat transfer, electromagnetic, and thermal fluid. The main product is the multi-physics (multiple physical forces) analysis tool “ANSYS,” a product of ANSYS, Inc. (U.S.) |
Optical Design
| It provides optical analysis such as lens design, illumination analysis, optical communication system analysis and measurement tools related to organic EL and optical member characteristics, and solutions and services. Main products include “CODE V” (optical design evaluation program) and “LightTools” (analytical software for lighting design) manufactured by Synopsys, Inc. (U.S.) |
MBD (Model Based Development) | MBD is a design methodology that implements a development process of plan, design, and verification based on formula models. Main products include the STEM computing platform “Maple” and the system-level modeling and simulation tool “MapleSim”, both of which are provided by the Canadian subsidiary. |
Other fields | The 3D tolerance management tool (cost and quality optimization based on the assembly part dimension of the evaluation object and evaluation on variation of part) is a product of the U.S. subsidiary and optimized design support tools (analysis automation, robust control/reliability evaluation, application of quality engineering, etc.) by the Belgian subsidiary. |
IT Solution Services
IT Solution Services offer security related solutions centered on Symantec’s endpoint security products that prevent computer virus infections and information leaks in the servers and client PCs, IT asset management solutions (multiple sales of major products) including “SKYSEA Client View” (SKY Inc.) and “QND Advance” (Quality Software Inc.), and cloud-based single sign-on/access control (IDaaS) solutions using IDaaS (Cloud ID Management) product “OneLogin.”
1-2 Major subsidiaries
Name of the company | Country | Business overview |
CYBERNET SYSTEMS (SHANGHAI) CO., LTD. | China | It provides CAE total solutions including sales and support, education, consulting, etc., focusing on products developed by the Cybernet Group as well as optical software, structural analysis, thermal fluid analysis |
CYBERNET SYSTEMS TAIWAN CO., LTD. (Investment ratio 57%) | Taiwan | It provides CAE total solutions including sales and support, education, consulting, etc. focusing on products developed by the Cybernet Group as well as optical software, structural analysis, thermal fluid analysis |
CYFEM Inc. (Investment ratio 65%) | South Korea | It provides CAE total solutions including sales and support, education, consulting, etc., focusing on optical software |
CYBERNET SYSTEMS MALAYSIA SDN. BHD. | Malaysia | It provides CAE total solutions including sales and support, education, consulting, etc. focusing on products developed by the Cybernet Group as well as optical software, structural analysis, thermal fluid analysis |
CYBERNET MBSE CO., LTD. | Japan | It provides engineering services such as contract analysis and consulting for model-based development, and develops and sells software |
Sigmetrix, L.L.C. | The U.S. | It develops and sells 3D tolerance management tools and provides consulting services |
WATERLOO MAPLE INC. | Canada | It develops and sells system-level modeling and simulation and provides consulting services |
Noesis Solutions NV | Belgium | It develops and sells optimized design support tools and provides consulting services |
2.Fiscal Year Ended December 2019 Earnings Results
2-1 Consolidated results (cumulative)
| FY12/18 (cumulative) | Ratio to sales | FY12/19 (cumulative) | Ratio to sales | YoY | Forecast | Compared with the initial forecasts |
Sales | 19,719 | 100.0% | 21,350 | 100.0% | +8.3% | 20,000 | +6.8% |
Gross profit | 7,904 | 40.1% | 8,481 | 39.7% | +7.3% | - | - |
SG&A expenses | 6,402 | 32.5% | 6,461 | 30.3% | +0.9% | - | - |
Operating Income | 1,502 | 7.6% | 2,020 | 9.5% | +34.5% | 1,520 | +32.9% |
Ordinary Income | 1,684 | 8.5% | 2,145 | 10.0% | +27.4% | 1,608 | +33.4% |
Net Income | -656 | - | 1,258 | 5.9% | - | 958 | +31.3% |
*Unit: ¥mn
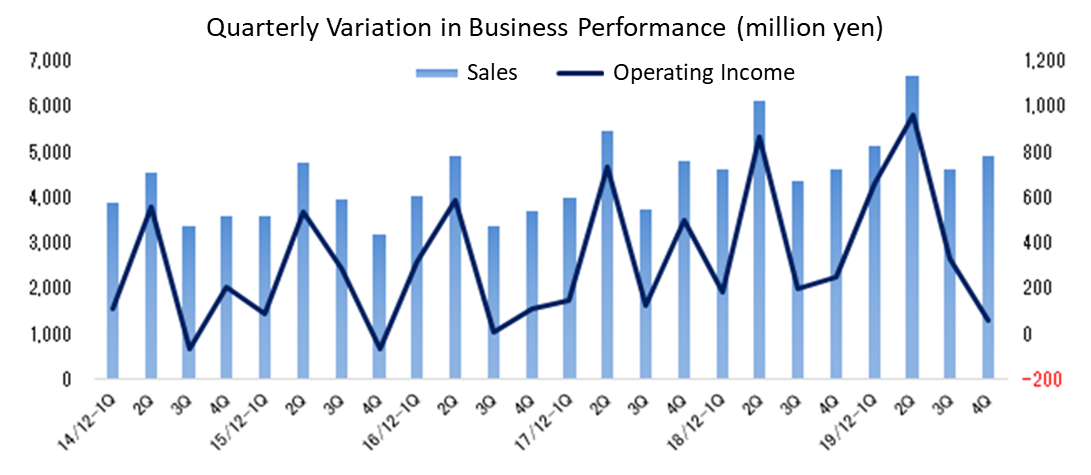
Sales and operating income grew 8.3% and 34.5% year on year, respectively
Sales grew 8.3% year on year to 21,350 million yen. Unconsolidated sales grew 8.9% year on year led by the business in transportation equipment and electric machinery industries. Also, sales of development subsidiaries in the United States and sales of subsidiaries in Asia were also strong.
Operating income increased 34.5% year on year to 2,020 million yen. Although the cost ratio rose 0.4 points due to a change in sales composition, it was absorbed by an increase in sales, and gross profit increased 7.3% year on year. SG&A expenses increased only slightly despite an increase in overall costs due to business expansion because there was no recording of goodwill amortization. As a result, the operating income margin improved from 1.9 points to 9.5%.
In the previous fiscal year, the company recorded extraordinary losses of 2,060 million yen due to loss on disposal of fixed assets and impairment loss, etc. Extraordinary losses for the current fiscal year were only 74 million yen, including a provision of allowance for doubtful accounts of 59 million yen.
Sales composition (consolidated)
By business | FY 12/18 | FY 12/19 |
| By sales form | FY 12/18 | FY 12/19 |
| By region | FY 12/18 | FY 12/19 |
CAE | 85.2% | 82.0% |
| Distributor | 71.6% | 72.4% |
| Japan | 78.8% | 78.4% |
IT | 14.8% | 18.0% |
| Vender (in-house) | 15.7% | 15.0% |
| North America | 6.9% | 7.1% |
|
|
|
| Service | 12.7% | 12.6% |
| Asia | 9.8% | 11.0% |
|
|
|
|
|
|
|
| Europe | 4.3% | 3.2% |
|
|
|
|
|
|
|
| Others | 0.2% | 0.3% |
Net Sales by Category of Industry (non-consolidated)
| FY 12/18 | Component ratio | FY 12/19 | Component ratio | YoY |
Electrical equipment | 4,680 | 29.8% | 4,962 | 29.0% | +6.0% |
Machinery & Precision Machinery | 2,419 | 15.4% | 2,599 | 15.2% | +7.4% |
Transportation equipment | 2,295 | 14.6% | 2,462 | 14.4% | +7.3% |
Other manufacturing industry | 2,014 | 12.8% | 2,338 | 13.7% | +16.1% |
Education institution/government and municipal offices | 1,356 | 8.6% | 1,409 | 8.2% | +3.9% |
Information and Communications | 876 | 5.6% | 974 | 5.7% | +11.1% |
Others | 2,086 | 13.3% | 2,388 | 13.9% | +14.5% |
Total | 15,729 | 100.0% | 17,134 | 100.0% | +8.9% |
*Unit: ¥mn
Trend by segment
| FY 12/18 | Composition Ratio/Profit Margin | FY 12/19 | Composition Ratio/Profit Margin | YoY |
CAE Solution Services | 16,791 | 85.2% | 17,497 | 82.0% | +4.2% |
IT Solution Services | 2,927 | 14.8% | 3,853 | 18.0% | +31.6% |
Consolidated sales | 19,719 | - | 21,350 | - | +8.3% |
CAE Solution Services | 2,535 | 15.1% | 3,285 | 18.8% | +29.6% |
IT Solution Services | 105 | 3.6% | 296 | 7.7% | +180.7% |
Adjustments | -1,139 | - | -1,562 | - | - |
Consolidated operating income(Operating income margin) | 1,502 | 7.6% | 2,020 | 9.5% | +34.5% |
*Unit: ¥mn
CAE Solution Services
Sales increased to 17,497 million yen (up 4.2% year on year) and operating income increased to 3,285 million yen (up 29.6% year on year). Sales of new licenses for multi-physics analysis tools, the company’s core products, increased due to large orders from the heavy electrical and electronics industries and contributions from government and municipal office projects. Furthermore, sales of maintenance contract renewals also increased due to the wider use of optimization and modeling functions. Sales of engineering services also increased as a result of increased new orders and orders of continued projects from existing customers in the business related to Model Based Development (MBD) such as automatic driving and control system design for the automobile industry.
As for the subsidiaries, sales of Sigmetrix, L.L.C. (the U.S.), which has strong sales of 3D tolerance management tools in North America and Asia, and sales of CYBERNET SYSTEMS (SHANGHAI) CO., LTD. and CYBERNET SYSTEMS TAIWAN CO., LTD. which mainly sell optical software and multi-physics analysis tools, and CYBERNET SYSTEMS MALAYSIA SDN.BHD. (Malaysia), which started operations in March 2019, also grew.
IT Solution Services
Sales grew to 3,853 million yen (up 31.6% year on year) and operating income increased to 296 million yen (up 180.7% year on year). The healthy sales were due to the strong performance of Cybernet Cloud (cloud-based IT asset management service)that offers IT asset management (multiple sales of main products) solutions and an increase in the number of cloud service users of Cloud Security CASB (Cloud Access Security Broker) solutions.
2-2 4Q Consolidated results (October to December)
| 4Q of FY12/18 (October- December) | Composition ratio | 4Q of FY12/19 (October- December) | Composition ratio | YoY |
Sales | 4,621 | 100.0% | 4,919 | 100.0% | +6.4% |
Gross profit | 1,903 | 41.2% | 1,925 | 39.1% | +1.2% |
SG & A expenses | 1,651 | 35.7% | 1,861 | 37.8% | +12.7% |
Operating Income | 252 | 5.5% | 63 | 1.3% | -74.7% |
Ordinary Income | 345 | 7.5% | 90 | 1.8% | -73.8% |
Net Income | 422 | 9.1% | -69 | - | - |
*Unit: ¥mn
Sales up 6.4% YoY, operating income down 74.7% YoY
Sales increased to 4,919 million yen, up 6.4% year on year. The sales growth rate on a consolidated basis slowed down due to a decrease in revenue year on year in the transportation equipment industry (down 23.9% on a non-consolidated basis). The transportation equipment industry is keen to invest in CASE-related development in the long run, but is cautious for short-term investment.
Operating income decreased 74.7% year on year to 63 million yen. While the gross profit margin declined due to changes in the sales composition ratio, SG&A expenses increased due to internal infrastructure investment (Windows 10 installation) and ERP installment costs, etc. The company recorded a provision of allowance for doubtful accounts of 59 million yen in extraordinary losses, resulting in a net loss of 69 million yen.
Net Sales by Category of Industry(Individual)
| 4Q of FY12/18 (October- December) | Composition ratio | 4Q of FY12/19 (October-December) | Composition ratio | YoY |
Electrical equipment | 965 | 26.9% | 1,109 | 29.1% | +14.9% |
Machinery & Precision Machinery | 527 | 14.7% | 505 | 13.2% | -4.3% |
Transportation equipment | 660 | 18.4% | 502 | 13.2% | -23.9% |
Other manufacturing industry | 515 | 14.4% | 578 | 15.2% | +12.2% |
Education institution/government and municipal offices | 249 | 6.9% | 333 | 8.7% | +33.9% |
Information and Communications | 185 | 5.2% | 177 | 4.6% | -4.5% |
Others | 486 | 13.6% | 610 | 16.0% | +25.5% |
Total | 3,590 | 100.0% | 3,817 | 100.0% | +6.3% |
* Unit: ¥mn
2-3 Balance Sheet and Cash Flow Statement
Balance sheet
| December 2018 | December 2019 |
| December 2018 | December 2019 |
Cash and deposits | 4,467 | 3,019 | Trade payables | 1,391 | 1,493 |
Trade receivables | 4,570 | 4,382 | Advance received | 1,995 | 2,021 |
Securities | 4,000 | 7,000 | Current liabilities | 4,972 | 5,925 |
Short-term loan receivable | 3,086 | 3,360 | Net defined benefit liability | 1,327 | 1,230 |
Current assets | 17,440 | 19,022 | Liabilities | 1,375 | 1,259 |
Intangible assets | 322 | 280 | Net assets | 12,867 | 13,636 |
Investments, others | 1,153 | 1,153 | Total liabilities, net assets | 19,215 | 20,821 |
Noncurrent assets | 1,775 | 1,799 | Total interest-bearing liabilities | - | - |
*Unit: ¥mn
Total assets at the end of the fiscal year increased 1,605 million yen from the end of the previous fiscal year to 20,821 million yen. Loans, which are based on surplus investment securities and the group bank system, to the parent company, FUJI SOFT INCORPORATED, increased. The equity ratio is 64.7% (66.3% at the end of the previous fiscal year).
Cash flow statement
| FY 12/18 | FY 12/19 | YoY | |
Operating Cash Flow (A) | 1,236 | 2,590 | +1,353 | +109.5% |
Investing Cash Flow (B) | -308 | -482 | -173 | - |
Free Cash Flow (A∔B) | 927 | 2,107 | +1,179 | +127.2% |
Financing Cash Flow | -523 | -512 | +11 | - |
Cash, Equivalents at the end of term | 8,378 | 9,935 | +1,556 | +18.6% |
*Unit: ¥mn
Operating CF secured a surplus of 2,590 million yen due to an increase in net income before income taxes of 2,071 million yen (253 million yen in the previous year) and depreciation of 225 million yen (298 million yen in the previous year). The net outflow of investing CF is due to the acquisition of tangible and intangible assets, etc., and the net outflow of financing CF is due to the payment of dividends.
Reference: Changes in ROE
| FY 12/15 | FY 12/16 | FY 12/17 | FY 12/18 | FY 12/19 |
ROE | 3.35% | 3.43% | 6.80% | -4.89% | 9.60% |
Net income margin | 2.99% | 2.88% | 5.21% | -3.33% | 5.89% |
Total asset turnover | 0.80 times | 0.83 times | 0.89 times | 0.98 times | 1.07 times |
Leverage | 1.40x | 1.42x | 1.46x | 1.49x | 1.53x |
*ROE = Net income margin × Total asset turnover × Leverage
*Total assets and capital required for calculation are average balance during the period.
3. Fiscal Year Ending December 2020 Earnings Forecasts
3-1 Consolidated Earnings
| FY 12/19 Act. | Composition Ratio | FY 12/20 Est. | Composition Ratio | YoY |
Sales | 21,350 | 100.0% | 22,000 | 100.0% | +3.0% |
Operating Income | 2,020 | 9.5% | 2,060 | 9.4% | +2.0% |
Ordinary Income | 2,145 | 10.0% | 2,140 | 9.7% | -0.3% |
Net Income | 1,258 | 5.9% | 1,300 | 5.9% | +3.3% |
*Unit: ¥mn
Sales and operating income are estimated to increase by 3.0% and 2.0% year on year, respectively
Although the effects of the COVID-19 outbreak were not factored in, the estimates were conservative, taking account of risks.
The company will implement initiatives based on the Medium-Term Business Plan. Specifically, it will strengthen the management of overseas subsidiaries by rebuilding the Group’s governance system and strengthening business management (it will not only work on the management but also actively work on the sales and technical aspects). It will also introduce ERP.
The company also plans to invest aggressively in the fields of CAE solutions, AI and security, and as part of this effort, it established a subsidiary of MBSE in January. Furthermore, it will strengthen overseas sales including ASEAN. Although the Malaysian subsidiary has been launched as scheduled, agent networks are still being established in each country to cover the entire ASEAN region (currently, progress varies by country).
Annual dividend is estimated to be 20.86 yen per share
The company will pay an interim dividend of 10.43 yen and a term-end dividend of 10.43 yen, for a total annual dividend of 20.86 yen (payout ratio is 50% and net assets dividend rate is 4.7%). The company uses either the dividend payout ratio of 50% or the net assets (shareholders’ equity) dividend ratio of 3.0%, whichever is higher, as a reference index for determining the dividend amount. Considering all the factors, the dividend amount is also determined based on the amount of medium to long-term investment to increase corporate value in the future.
| FY 12/16 | FY 12/17 | FY 12/18 | FY 12/19 | FY 12/20 Est. |
Dividend per share (yen) | 13.00 | 15.05 | 16.52 | 20.19 | 20.86 |
Net income per share (yen) | 14.83 | 30.09 | -21.07 | 40.38 | 41.72 |
Payout ratio | 87.7% | 50.0% | - | 50.0% | 50.0% |
Net assets dividend rate | 3.0% | 3.4% | 3.8% | 4.8% | 4.7% |
4. Conclusions
Sales and operating income are estimated to increase slightly in the fiscal year 2020. From the experience of posting impairment loss in the fiscal year 2018 (net loss of 656 million yen), the company determined the achievable estimates, factoring in risks. What is required of earnings estimates is accuracy, and does not mean “it is ok if they do not downturn”. However, conservative estimates are unavoidable given the uncertainty of the business situation of major customers (manufacturing industry) in association with the conflict between the U.S. and China. Also, far from ending, a sign indicating the end of the COVID-19 outbreak is still not evident. In this situation, conservative estimates are inevitable. To avoid misleading investors, we would like to pay attention to how much the company can add to the initial forecast while expecting a detailed explanation about trends of each industry, technology trends, and prospects for cost, etc. from the company.
Although there is uncertainty in the short term, the business environment in the medium to long term is favorable. At the site of manufacturing, the issues have been solved by simulating a single domain as usual. However, considering all the factors, it becomes increasingly necessary to establish a simulation technique that addresses the issues of structure, fluid, heat transfer, and light from a comprehensive perspective, instead of addressing them individually. Furthermore, as for the utilization of IoT, big data, and AI, it will be possible to provide dramatic solutions by combining them with CAE and visualization technologies, leveraging the company’s strength. With a focus on the generative design using AI, digital twin using IoT, and AR/VR technologies that will facilitate virtual engineering, the company is planning to actively expand its alliances with domestic and overseas vendors and carry out collaborative research and development, etc., with experts.
<Reference: Regarding Corporate Governance>
◎ Organization type, and the composition of directors and auditors
Organization type | Company with audit and supervisory board members |
Directors | 8 directors, including 2 outside ones |
Auditors | 3 auditors, including 2 outside ones |
◎ Corporate Governance Report:The Latest Update: March 13, 2020
Basic Policy
Our company will thoroughly observe all applicable laws and regulations in all corporate activities and take actions that conform to social ethics as we have set forth in the “Cybernet Group Compliance Policy Guidelines” (hereinafter referred to as “Cybernet Policy Guidelines”). This is our basic attitude towards all shareholders. In addition, we respect the Cybernet Policy Guidelines as our company’s basic policy in regard to corporate governance and we strive to ensure the soundness of our management, clarify accountability, and disclose impartial and timely information. We are also aiming to expedite management decisions and improve supervisory functions of business execution, as well as endeavoring to create organizations with effective risk management and screening functions.
<Reasons for Non-compliance with the Principles of the Corporate Governance Code>
We have implemented all the principles of corporate governance code.
<Disclosure Based on the Principles of the Corporate Governance Code (Excerpts)>
[Principle 4-9 Independence criteria and qualities of independent external directors]
When selecting candidates for independent external directors, the Company determines that it lacks independence if it falls under any of the following items. The person selected is someone who does not fall under any of the items below, is not likely to have a conflict of interest with general shareholders, and can be substantially secured independence.
(1) Person who has been a business executor of the Company or its subsidiary within the last 10 years or his/her relative within the second degree of kinship
(2) Person who falls under any of the following, or who were his/her relatives within their second degree, within 1 year
a. An executive of a company that has an important business relationship with the Company or an executive of its parent company or an important subsidiary
b. A lawyer, consultant, etc. of the Company or its subsidiaries who receives a large amount of compensation or other property benefits in addition to the remuneration for the Director from the Company
If it is a corporation/organization, or the like, the person executing the business of the corporation/organization
c. An executive of the Company’s parent company
d. An executive of a company that belongs to the parent company group of the Company
(3) Any other person who may have a constant and substantial conflict of interest with the general shareholders of the Company for reasons other than those considered in (1) and (2) above.
Principle 5-1 Policy on constructive interaction with shareholders
The Company has established a department in charge of IR, and appoints an IR officer, as the director in charge of the administrative department to design an organic collaboration within the administration department. In addition, the department will report IR activity to the representative director or director in charge once a quarter. Furthermore, regarding the management of insider information, please refer to the following “V.2 (3) Disclosure Policy” and the “Information Disclosure Standard (Disclosure Policy)” listed on our website via the URL below.
(Information Disclosure Standard (Disclosure Policy))
https://www.cybernet.jp/ir/ir_policy/standard/
The Company’s main IR activities are as follows:
(1) Financial results briefing (once a year)
(2) Medium-Term Business Plan briefing (once a year)
(3) General shareholders meeting (once a year)
(4) Individual interviews for institutional investors
(5) Provision of information by e-mail
This report is intended solely for information purposes, and is not intended as a solicitation for investment. The information and opinions contained within this report are made by our company based on data made publicly available, and the information within this report comes from sources that we judge to be reliable. However, we cannot wholly guarantee the accuracy or completeness of the data. This report is not a guarantee of the accuracy, completeness or validity of said information and opinions, nor do we bear any responsibility for the same. All rights pertaining to this report belong to Investment Bridge Co., Ltd., which may change the contents thereof at any time without prior notice. All investment decisions are the responsibility of the individual and should be made only after proper consideration. Copyright(C) 2020 Investment Bridge Co., Ltd. All Rights Reserved. |
To view back numbers of Bridge Reports on Cybernet Systems Co., Ltd. (4312) and other companies, or IR related seminars of Bridge Salon, please go to our website at the following URL.
https://www.bridge-salon.jp/