Bridge Report:(4312)Cybernet Systems the first half of fiscal year ending December 2020
![]()
 Reiko Yasue, President & CEO | Cybernet Systems Co., Ltd. (4312) |
|
Company Information
Company | TSE 1st Section |
Industry | Information and communications |
President | Reiko Yasue |
HQ Address | FUJISOFT Bldg. 3 Kanda-neribeicho, Chiyoda-ku, Tokyo |
Year-end | December |
Homepage |
Stock Information
Share Price | Number of shares issued (excluding treasury shares) | Total market cap | ROE(Act.) | Trading Unit | |
¥762 | 31,178,149 shares | ¥23,757million | 9.6% | 100 shares | |
DPS(Est.) | Dividend yield (Est.) | EPS(Est.) | PER(Est.) | BPS(Act.) | PBR(Act.) |
¥20.86 | 2.7% | ¥41.72 | 18.3 x | ¥432.12 | 1.8 x |
*The share price is the closing price on August 7. The number of shares issued was calculated by subtracting the treasury shares from the number of outstanding shares at the end of the latest quarter. ROE and BPS are from the last year-end.
Consolidated Earnings
Fiscal Year | Net Sales | Operating Income | Ordinary Income | Profit attributable to owners of parent | EPS (¥) | DPS (¥) |
December 2016(Act.) | 16,031 | 1,027 | 1,001 | 462 | 14.83 | 13.00 |
December 2017(Act.) | 17,987 | 1,504 | 1,639 | 937 | 30.09 | 15.05 |
December 2018(Act.) | 19,719 | 1,502 | 1,684 | -656 | -21.07 | 16.52 |
December 2019(Act.) | 21,350 | 2,020 | 2,145 | 1,258 | 40.38 | 20.19 |
December 2020(Est.) | 22,000 | 2,060 | 2,140 | 1,300 | 41.72 | 20.86 |
* Forecast is company forecast. Unit: ¥mn
This bridge report shows the results of Cybernet System Co., Ltd.'s financial results for the first half of fiscal year ending December 2020, and forecasts for the fiscal year ending December 2020.
Table of Contents
Key Points
1.Company Overview
2.First half of Fiscal Year December 2020 Earnings Results
3.Fiscal Year December 2020 Earnings Forecasts
4.Conclusions
<Reference: Regarding Corporate Governance>
Key points
- In the first half of the fiscal year 2020, sales and operating income grew 0.6% and 25.0% year on year, respectively. Although some customers canceled or postponed projects due to the spread of COVID-19, the negative impact was within the expected range. While consolidated sales were in line with the plan thanks to the increased sales in IT Solution Services through telecommuting and meeting the needs of IT asset management, and the steady growth in contract renewals in CAE Solution Services, the company’s efforts in cost reduction bore fruit, resulting in a significant increase in profit.
- Earnings estimates for the full fiscal year remain unchanged. Sales and operating income are estimated to increase 3.0% and 2.0% year on year, respectively. The company is “closely monitoring the impact of COVID-19 and will work to minimize the impact on its business performance.” It also strives to improve its operational productivity, recognizing the “coexistence with the virus = the era of leading our daily lives while coping with COVID-19,” while ensuring the safety and preventing infection of customers, other concerned parties, employees and their families. The company plans “to disclose the updated forecast promptly if it becomes necessary to revise its earnings forecast.” It will pay a term-end dividend of 10.43 yen, and when combined with the dividend at the end of the second quarter, the total annual dividend will be 20.86 yen, up 0.67 yen from the previous year (payout rati 50%).
- Sales were 54.0% of full-year estimates (55.3% in the same period last year on an actual full-year results basis) and operating income was 98.6% of full-year estimates (80.4% in the same period last year on an actual full-year results basis). Although the progress is at a high level, the company considers that customer trends are polarized with “budget restraint caused by deteriorating performance” and “continued investment in growth,” and uncertainty remains even in the second half of the year. In fact, automobile manufacturers, which are their main customers, have been hit hard by the COVID-19 crisis, and it is expected that their R&D investment will be more well-defined than ever before. We would like to pay attention to the company’s business operation in the environment where we always need to cope with COVID-19 in our daily lives.
1. Company Overview
With “Computer Aided Engineering (CAE) Solution” and “IT Solution” as two pillars of the business, Cybernet supports the manufacturing of goods, “Monozukuri.” CAE includes virtual designing and experimentation (simulation) on a computer. In the process of product development, CAE helps achieve high quality, shorten the development period, and reduce development cost. It is also environmentally friendly as it reduces waste materials generated by trial production. The Company is engaged in a license sales and maintenance service of more than 50 kinds of globally recognized software provided by more than 20 companies as well as an agency service to approximately 2,000 companies in the fields of automobiles, machinery, electric machinery and 500 research institutions and universities.
The company has formed a corporate group with 15 consolidated subsidiaries and operates the businesses in North America, the UK, France, Germany, Belgium, and Asia. Also, it owns 53.9% of the voting rights of FUJI SOFT INCORPORATED, which is listed on the First Section of the Tokyo Stock Exchange.
Corporate Philosophy
Cybernet’s corporate philosophy is “We will contribute to the advancement of our customers and society by providing solutions that generate high satisfaction through enhanced value-added and high-quality services.” With its corporate message of “Energy for your Innovation.” Cybernet aims to become the “First Contact Company” for customers for CAE, that always walks with them and that they trust.
1-1 Business Description
Cybernet’s business is divided into CAE Solution Services providing CAE solutions and related technical services, and IT Solution Services providing IT solutions centered on security-related solutions. CAE Solution Services account for over 80% of the entire business of the Group.
CAE Solution Services
Distributor Business and Vendor Business, both of which sell CAE software and hardware for analysis and simulation in conjunction with a Computer Aided Design (CAD) system, CAE Solution Services manage Consulting Business, design of electronic circuits and boards, model-based development (MBD, to be described later), engineering (consignment) services such as PIDO, and user education and support services such as holding seminars, user conferences, and case presentations.
CAE application areas
MCAE(Mechanical CAE) After completing the designing process using CAD, it provides software and services that support analysis of structure, heat transfer, electromagnetic, and thermal fluid. The main product is the multi-physics (multiple physical forces) analysis tool “ANSYS,” a product of ANSYS, Inc. (U.S.) |
Optical Design It offers optical analysis for lens design, etc., illumination analysis, optical communication system analysis and measurement tools related to organic EL and optical member characteristics, and solutions and services. Main products include “CODE V” (optical design evaluation program) and “LightTools” (analytical software for lighting design) both manufactured by Synopsys, Inc. (U.S.) |
MBD(Model Based Development) MBD is a design methodology that implements a development process of plan, design, and verification based on formula models. Main products include the STEM computing platform “Maple” and the system-level modeling and simulation tool “MapleSim”, both of which are provided by the Canadian subsidiary. |
Other fields The 3D tolerance management tool (optimization of costs and quality based on the assembly part dimensions of the evaluation object and evaluation on variation of parts), which is a product of the U.S. subsidiary, and optimized design support tools (analysis automation, robust control / reliability evaluation, application of quality engineering, etc.) by the Belgian subsidiary. |
IT Solution Services
IT Solution Services offer security related solutions centered on Broadcom’s endpoint security products(former name: Symantec Enterprise Security) that prevent computer virus infections and information leaks in the servers and client PCs, IT asset management solutions (multiple sales of major products) including “SKYSEA Client View” (SKY Inc.) and “QND Advance” (Quality Software Inc.), and cloud-based single sign-on/access control (IDaaS) solutions using IDaaS (Cloud ID Management) product “OneLogin.”
1-2 Major subsidiaries
Name of the company | Country | Business overview |
CYBERNET SYSTEMS (SHANGHAI) CO., LTD. | China | It provides CAE total solutions including sales and support, education, consulting, etc., focusing on products developed by the Cybernet Group and optical software, structural analysis, thermal fluid analysis |
CYBERNET SYSTEMS TAIWAN CO., LTD. (Investment ratio 57%) | Taiwan | It provides CAE total solutions including sales and support, education, consulting, etc. focusing on products developed by the Cybernet Group and optical software, structural analysis, thermal fluid analysis |
CYFEM Inc. (Investment ratio 65%) | South Korea | It provides CAE total solutions including sales and support, education, consulting, etc., focusing on optical software |
CYBERNET SYSTEMS MALAYSIA SDN. BHD | Malaysia | It provides CAE total solutions including sales and support, education, consulting, etc. focusing on products developed by the Cybernet Group and optical software, structural analysis, thermal fluid analysis |
CYBERNET MBSE CO., LTD. | Japan | It provides engineering services such as contract analysis and consulting for model-based development, and develops and sells software |
Sigmetrix, L.L.C. | The U.S. | It develops and sells 3D tolerance management tools and provides consulting services |
WATERLOO MAPLE INC. | Canada | It develops and sells system-level modeling and simulation and provides consulting services |
Noesis Solutions NV | Belgium | It develops and sells optimized design support tools and provides consulting services |
2.First half of Fiscal Year December 2020 Earnings Results
【Impact of the spread of COVID-19】
Due to the spread of COVID-19, some customers canceled or postponed projects, but the negative impact was within the scope expected in the first quarter. As for income, the company’s efforts in cost reduction bore fruit, with each income level exceeding the estimate. Impacts and initiatives in each segment are as below.
In CAE Solution Services, the impact on maintenance contract renewals was limited, but the purchase of licenses (new contracts) was canceled or postponed by some customers. In Engineering Services, some customers canceled or postponed their projects. As for sales, the company focused on expanding online interviews and online seminars, and actively participated in online events, in order to make up for the limitations of face-to-face sales. In addition, the company minimized the impact on its business performance through cost control.
IT Solution Services also experienced some customers canceling or postponing license purchases, but maintenance contract renewals were not significantly affected. The company promoted its cloud-based services and telework solutions to meet customer needs for new lifestyles which copes with COVID-19 in the post-pandemic world, as well as expanded its online seminars and minimized the impact of the infection on business performance through cost control.
2-1 Consolidated results for the first half
| 1H of FY12/19 | Ratio to sales | 1H of FY12/20 | Ratio to sales | YoY | Forecast | Compared with Forecasts |
Sales | 11,798 | 100.0% | 11,871 | 100.0% | +0.6% | 11,870 | +0.0% |
Gross profit | 4,734 | 40.1% | 4,876 | 41.1% | +3.0% | - | - |
SG&A expenses | 3,109 | 26.4% | 2,845 | 24.0% | -8.5% | - | - |
Operating Income | 1,624 | 13.8% | 2,031 | 17.1% | +25.0% | 1,650 | +23.1% |
Ordinary Income | 1,657 | 14.0% | 2,011 | 16.9% | +21.4% | 1,690 | +19.0% |
Net Income | 1,049 | 8.9% | 1,343 | 11.3% | +28.0% | 1,082 | +24.1% |
*Unit: ¥mn
Sales and operating income increased 0.6% and 25.0% year on year, respectively
Sales grew 0.6% year on year to 11,870 million yen, in line with the plan. Despite a 0.5% decrease in sales of CAE Solution Services, sales of IT Solution Services, which tapped into telecommuting and IT asset management needs, increased 5.8% year on year. In CAE Solution Services, while maintenance contract renewals for multi-physics analysis and optical analysis tools, mainly in mechanical, precision, and other manufacturing industries saw some progress, license sales declined. Engineering Services were sluggish, particularly in the automotive sector.
Operating income augmented 25.0% year on year to 2,030 million yen. Gross profit increased 3.0% year on year due to an increase in sales in Japan which accounted for 82.5% of consolidated sales, mainly from contract renewals, and an improvement in the cost ratio as a result of a decrease in technical service costs, including lower outsourced processing, and travel and transportation expenses. On the other hand, SG&A expenses dropped 8.5% year on year, as a result of lower travel expenses and lower equipment costs associated with the floor renovation in the previous term. Despite a decline in non-operating income due to lower subsidy income, net income was 1,340 million yen, up 28.0% year on year.
Sales by Category of Industry(Individual)
| 1H of FY 12/19 | Component ratio | 1H of FY 12/20 | Component ratio | YoY |
Electrical equipment | 2,998 | 30.7% | 2,799 | 28.8% | -6.6% |
Machinery & Precision Machinery | 1,486 | 15.2% | 1,718 | 17.7% | +15.6% |
Transportation equipment | 1,430 | 14.7% | 1,043 | 10.7% | -27.0% |
Other manufacturing industry | 1,170 | 12.0% | 1,377 | 14.1% | +17.7% |
Education institution/government and municipal offices | 803 | 8.2% | 773 | 7.9% | -3.7% |
Information and Communications | 604 | 6.2% | 555 | 5.7% | -8.0% |
Others | 1,261 | 12.9% | 1,467 | 15.1% | +16.3% |
Total | 9,754 | 100.0% | 9,735 | 100.0% | -0.2% |
*Unit: ¥mn
Sales by Contract type(Individual)
| 1H of FY 12/19 | Component ratio | 1H of FY 12/20 | Component ratio | YoY |
Licenses | 8,688 | 100.0% | 8,945 | 100.0% | +3.0% |
New licenses | 2,807 | 32.3% | 2,702 | 30.2% | -3.7% |
Renewals | 5,880 | 67.7% | 6,243 | 69.8% | +6.2% |
Others | 1,066 | - | 789 | - | -26.0% |
Total | 9,754 | - | 9,735 | - | -0.2% |
*Unit: ¥mn
2-2 Trend by segment
| 1H of FY 12/19 | Composition Ratio/Profit Margin | 1H of FY 12/20 | Composition Ratio/Profit Margin | YoY |
CAE Solution Services | 9,732 | 82.5% | 9,684 | 81.6% | -0.5% |
IT Solution Services | 2,066 | 17.5% | 2,186 | 18.4% | +5.8% |
Consolidated sales | 11,798 | - | 11,871 | - | +0.6% |
CAE Solution Services | 2,186 | 22.5% | 2,573 | 26.6% | +17.7% |
IT Solution Services | 204 | 9.9% | 138 | 6.3% | -32.3% |
Adjustments | -765 | - | -680 | - | - |
Consolidated operating income(Operating income margin) | 1,624 | 13.8% | 2,031 | 17.1% | +25.0% |
*Unit: ¥mn
CAE Solution Services
Sales declined to 9,680 million yen (down 0.5% year on year), and segment profit increased to 2,570 million yen (up 17.7% year on year). Sales of new licenses for multi-physics analysis and optical analysis tools, which are the company’s core products, dropped with some customers canceling or postponing installation due to the COVID-19 crisis, but was offset by the increased maintenance contract renewals, mainly in mechanical, precision, and other manufacturing industries. On the other hand, sales of Engineering Services fell due to postponement of new MBD-related operations in the overall automobile industry because of COVID-19. Furthermore, sales of User Education and Support Services declined as the commencement of some projects was delayed and paid group-education seminars were canceled.
Overseas, sales in Asia increased, mainly at the Taiwanese subsidiary, where sales of multi-physics analysis tools and optical software were healthy, and at the South Korean subsidiary, where sales of optical software were strong, but sales in North America, Europe, and other regions fell.
IT Solution Services
Sales augmented to 2,180 million yen (up 5.8% year on year), while segment profit dropped to 130 million yen (down 32.3% year on year). Renewals for endpoint security solutions and cloud security solutions increased, and customer-support solutions for IT asset management driven by PC management needs also grew. However, changes in the sales mix caused a drop in profit margin, which lowered the profits.
Sales by Region (Region of the End-user)
| 1H of FY 12/19 | Component ratio | 1H of FY 12/20 | Component ratio | YoY |
Japan | 9,711 | 82.3% | 9,789 | 82.5% | +0.8% |
Asia | 1,148 | 9.7% | 1,184 | 10.0% | +3.1% |
North America | 624 | 5.3% | 615 | 5.2% | -1.4% |
Europe | 282 | 2.4% | 260 | 2.2% | -7.8% |
Other | 32 | 0.3% | 20 | 0.2% | -34.8% |
Total | 11,798 | 100.0% | 11,871 | 100.0% | +0.6% |
*Unit: ¥mn
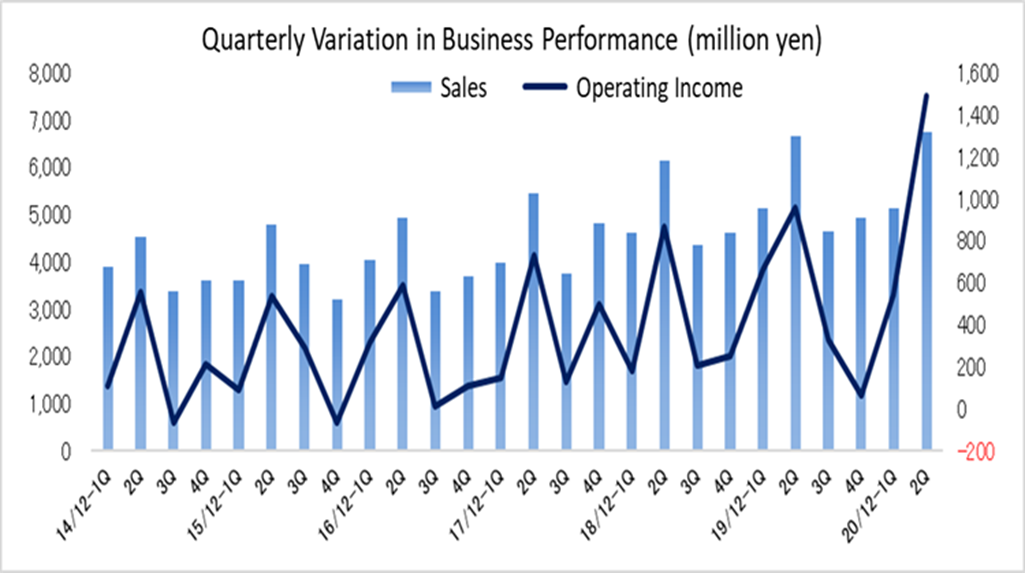
2-3 Results of the Second Quarter
| 12/19-1Q | 2Q | 3Q | 4Q | 12/20-1Q | 2Q | YoY | Quarter to Quarter |
Sales | 5,140 | 6,658 | 4,632 | 4,919 | 5,119 | 6,751 | +1.4% | +31.9% |
Gross profit | 2,097 | 2,636 | 1,822 | 1,925 | 1,992 | 2,883 | +9.4% | +44.7% |
SG&A expenses | 1,433 | 1,675 | 1,490 | 1,861 | 1,450 | 1,394 | -16.8% | -3.8% |
Operating Income | 664 | 960 | 331 | 63 | 542 | 1,488 | +55.0% | +174.5% |
Ordinary Income | 680 | 976 | 397 | 90 | 578 | 1,432 | +46.7% | +147.5% |
Net Income | 406 | 642 | 278 | -69 | 398 | 944 | +47.0% | +136.8% |
Gross Profit Margin | 40.8% | 39.6% | 39.3% | 39.1% | 38.9% | 42.7% | - | - |
SG&A Ratio | 27.9% | 25.2% | 32.2% | 37.8% | 28.3% | 20.7% | - | - |
*Unit: ¥mn
Sales and operating income rose 1.4% and 55.0% year on year, respectively
In the second quarter (April to June), sales rose 1.4% year on year to 6,750 million yen due to higher sales in Asia and North America, as well as the solid performance in Japan, mainly due to maintenance contract renewals. As for profit, operating income margin improved 7.7 points to 22.1% and operating income were 1,480 million yen, up 55.0% year on year, thanks to the contribution of high-margin maintenance contracts and decreased technical service costs and SG&A expenses as a result of refraining from service-offering and sales activities due to the spread of COVID-19.
Sales by Region (Region of the End-user)
| 2Q of FY 12/19(April to June) | Component ratio | 2Q of FY 12/20(April to June) | Component ratio | YoY |
Japan | 5,678 | 85.3% | 5,714 | 84.6% | +0.6% |
Asia | 506 | 7.6% | 596 | 8.8% | +17.6% |
North America | 301 | 4.5% | 321 | 4.8% | +6.6% |
Europe | 157 | 2.4% | 108 | 1.6% | -30.9% |
Other | 14 | 0.2% | 10 | 0.2% | -27.1% |
Total | 6,658 | 100.0% | 6,751 | 100.0% | +1.4% |
*Unit: ¥mn
Sales by Category of Industry(Individual)
| 2Q of FY 12/19(April to June) | Component ratio | 2Q of FY 12/20(April to June) | Component ratio | YoY |
Electrical equipment | 2,042 | 35.9% | 2,003 | 35.3% | -1.9% |
Machinery & Precision Machinery | 839 | 14.8% | 1,002 | 17.7% | +19.4% |
Transportation equipment | 630 | 11.1% | 537 | 9.5% | -14.8% |
Other manufacturing industry | 662 | 11.6% | 623 | 11.0% | -5.8% |
Education institution/government and municipal offices | 471 | 8.3% | 498 | 8.8% | +5.7% |
Information and Communications | 349 | 6.1% | 318 | 5.6% | -8.9% |
Others | 695 | 12.2% | 694 | 12.2% | -0.1% |
Total | 5,691 | 100.0% | 5,678 | 100.0% | -0.2% |
*Unit: ¥mn
Sales by Contract type(Individual)
| 2Q of FY 12/19(April to June) | Component ratio | 2Q of FY 12/20(April to June) | Component ratio | YoY |
Licenses | 5,298 | 100.0% | 5,367 | 100.0% | +1.3% |
New licenses | 1,444 | 27.3% | 1,418 | 26.4% | -1.8% |
Renewals | 3,853 | 72.7% | 3,948 | 73.6% | +2.5% |
Others | 393 | - | 310 | - | -20.9% |
Total | 5,691 | - | 5,678 | - | -0.2% |
*Unit: ¥mn
2-4 Balance Sheet and Cash Flow Statement
Balance sheet
| December 2019 | June 2020 |
| December 2019 | June 2020 |
Cash and deposits | 3,019 | 3,761 | Trade payables | 1,493 | 1,775 |
Trade receivables | 4,382 | 5,000 | Advance received | 2,021 | 2,013 |
Securities | 7,000 | 7,500 | Current liabilities | 5,925 | 5,609 |
Short-term loan receivable | 3,360 | 2,452 | Net defined benefit liability | 1,230 | 1,244 |
Current assets | 19,022 | 19,750 | Liabilities | 1,259 | 1,272 |
Intangible assets | 280 | 413 | Net assets | 13,636 | 14,566 |
Investments, others | 1,153 | 936 | Total liabilities, net assets | 20,821 | 21,449 |
Noncurrent assets | 1,799 | 1,698 | Total interest-bearing liabilities | - | - |
*Unit: ¥mn
Total assets at the end of the second quarter were 21,440 million yen, up 620 million yen from the end of the previous term. Short-term loans in current assets are loans to the parent company’s cash management system (CMS) for short-term cash management. Equity ratio was 67.1% (64.7% at the end of the previous term).
Cash flow statement
| 1H of FY 12/19 | 1H of FY 12/20 | YoY | |
Operating Cash Flow (A) | 1,792 | 1,039 | -753 | -42.0% |
Investing Cash Flow (B) | 19 | 667 | +647 | +3260.3% |
Free Cash Flow (A∔B) | 1,812 | 1,707 | -105 | -5.8% |
Financing Cash Flow | -271 | -416 | -144 | - |
Cash, Equivalents at the end of term | 9,869 | 11,182 | +1,313 | +13.3% |
*Unit: ¥mn
Operating CF was 1,039 million yen due to net income before income taxes of 2,000 million yen (1,650 million yen in the same period last year), a depreciation of 110 million yen (120 million yen in the same period last year), increased working capital (higher trade receivables and lower provision for bonuses), and a tax payment, including corporate tax, of 490 million yen (170 million yen in the same period last year). The inflow of investing CF is mainly due to the collection of loans associated with CMS, which is operated by the parent company, and the outflow of financing CF is due to the payment of dividends etc.
3. Fiscal Year December 2020 Earnings Forecasts
3-1 Consolidated Earnings
| FY 12/19 Act. | Composition Ratio | FY 12/20 Est. | Composition Ratio | YoY |
Sales | 21,350 | 100.0% | 22,000 | 100.0% | +3.0% |
Operating Income | 2,020 | 9.5% | 2,060 | 9.4% | +2.0% |
Ordinary Income | 2,145 | 10.0% | 2,140 | 9.7% | -0.3% |
Net Income | 1,258 | 5.9% | 1,300 | 5.9% | +3.3% |
*Unit: ¥mn
Earnings estimates remain unchanged., with sales and operating income expected to increase 3.0% and 2.0% year on year, respectively
The company is “closely monitoring the impact of COVID-19 and will work to minimize the impact on its business performance.” It also strives to improve its operational productivity, recognizing the “coexistence with the virus = the era of leading our daily lives while coping with COVID-19,” while ensuring the safety and preventing infection of customers, other concerned parties, employees and their families. The company plans “to disclose the updated forecast promptly if it becomes necessary to revise its earnings forecast.”
3-2 Term-end dividend is to be 10.43 yen per share, and annual dividend is projected to be 20.86 yen
It will pay a term-end dividend of 10.43 yen per share, and when combined with the dividend at the end of the second quarter, the total annual dividend will be 20.86 yen, up 0.67 yen from the previous year (payout rati 50%).
The company uses either the dividend payout ratio of 50% or the net assets (shareholders’ equity) dividend ratio of 3.0%, whichever is higher, as a reference index for determining the dividend amount. Considering all the factors, the dividend amount is also determined based on the amount of medium to long-term investment to increase corporate value in the future.
| FY 12/16 | FY 12/17 | FY 12/18 | FY 12/19 | FY 12/20 Est. |
Dividend per share (yen) | 13.00 | 15.05 | 16.52 | 20.19 | 20.86 |
Net income per share (yen) | 14.83 | 30.09 | -21.07 | 40.38 | 41.72 |
Payout ratio | 87.7% | 50.0% | - | 50.0% | 50.0% |
Net assets dividend rate* | 3.0% | 3.4% | 3.8% | 4.8% | 4.7% |
* DOE for the fiscal year 2020 is calculated based on net assets at the beginning of the term.
4. Conclusions
Sales were 54.0% of the full-year estimates (55.3% in the same period last year on an actual full-year results basis), operating income was 98.6% of full-year estimates (80.4% in the same period last year on an actual full-year results basis), ordinary income was 94.0% of the full-year estimate (77.2% in the same period last year on an actual full-year results basis), and net income was 103.3% of the full-year estimate (83.4% in the same period last year on an actual full-year results basis). Although the progress is at a high level, the company considers that customer trends are polarized with “budget restraint caused by deteriorating performance” and “continued investment in growth,” and uncertainty remains even in the second half of the year. In fact, automobile manufacturers, which are their main customers, have been hit hard by the COVID-19 crisis, and it is expected that their R&D investment will be more well-defined than ever before. In addition, it will be difficult to achieve the same level of success in online sales as in face-to-face sales with new license sales, aside from contract renewals. We would like to pay attention to their business operation in the environment where we always need to cope with COVID-19 in our daily lives.
<Reference: Regarding Corporate Governance>
◎ Organization type, and the composition of directors and auditors
Organization type | Company with audit and supervisory board members |
Directors | 8 directors, including 2 outside ones |
Auditors | 3 auditors, including 2 outside ones |
◎ Corporate Governance Report:The Latest Update: March 28, 2020
Basic Policy
Our company will thoroughly observe all applicable laws and regulations in all corporate activities and take actions that conform to social ethics as we have set forth in the “Cybernet Group Compliance Policy Guidelines” (hereinafter referred to as “Cybernet Policy Guidelines”). This is our basic attitude towards all shareholders. In addition, we respect the Cybernet Policy Guidelines as our company’s basic policy in regard to corporate governance and we strive to ensure the soundness of our management, clarify accountability, and disclose impartial and timely information. We are also aiming to expedite management decisions and improve supervisory functions of business execution, as well as endeavoring to create organizations with effective risk management and screening functions.
<Reasons for Non-compliance with the Principles of the Corporate Governance Code>
We have implemented all the principles of corporate governance code.
<Disclosure Based on the Principles of the Corporate Governance Code (Excerpts)>
[Principle 4-9 Independence criteria and qualities of independent external directors]
When selecting candidates for independent external directors, the Company determines that it lacks independence if it falls under any of the following items. The person selected is someone who does not fall under any of the items below, is not likely to have a conflict of interest with general shareholders, and can be substantially secured independence.
(1) Person who has been a business executor of the Company or its subsidiary within the last 10 years or his/her relative within the second degree of kinship
(2) Person who falls under any of the following, or who were his/her relatives within their second degree, within 1 year
a. An executive of a company that has an important business relationship with the Company or an executive of its parent company or an important subsidiary
b. A lawyer, consultant, etc. of the Company or its subsidiaries who receives a large amount of compensation or other property benefits in addition to the remuneration for the Director from the Company
If it is a corporation/organization, or the like, the person executing the business of the corporation/organization
c. An executive of the Company’s parent company
d. An executive of a company that belongs to the parent company group of the Company
(3) Any other person who may have a constant and substantial conflict of interest with the general shareholders of the Company for reasons other than those considered in (1) and (2) above.
Principle 5-1 Policy on constructive interaction with shareholders
The Company has established a department in charge of IR, and appoints an IR officer, as the director in charge of the administrative department to design an organic collaboration within the administration department. In addition, the department will report IR activity to the representative director or director in charge once a quarter. Furthermore, regarding the management of insider information, please refer to the following “V.2 (3) Disclosure Policy” and the “Information Disclosure Standard (Disclosure Policy)” listed on our website via the URL below.
(Information Disclosure Standard (Disclosure Policy))
https://www.cybernet.jp/english/ir/ir_policy/standard/
The Company’s main IR activities are as follows:
(1) Financial results briefing (once a year)
(2) Medium-Term Business Plan briefing (once a year)
(3) General shareholders meeting (once a year)
(4) Individual interviews for institutional investors
(5) Provision of information by e-mail
This report is intended solely for information purposes, and is not intended as a solicitation for investment. The information and opinions contained within this report are made by our company based on data made publicly available, and the information within this report comes from sources that we judge to be reliable. However, we cannot wholly guarantee the accuracy or completeness of the data. This report is not a guarantee of the accuracy, completeness or validity of said information and opinions, nor do we bear any responsibility for the same. All rights pertaining to this report belong to Investment Bridge Co., Ltd., which may change the contents thereof at any time without prior notice. All investment decisions are the responsibility of the individual and should be made only after proper consideration. Copyright(C) 2020 Investment Bridge Co., Ltd. All Rights Reserved. |
To view back numbers of Bridge Reports on Cybernet Systems Co., Ltd. (4312) and other companies, or IR related seminars of Bridge Salon, please go to our website at the following URL.
URL : https://www.bridge-salon.jp/