Bridge Report:(6914)OPTEX GROUPThe Third Quarter of Fiscal Year December 2019
![]()
 Isamu Oguni President and CEO | OPTEX GROUP (6914) |
 |
Company Information
Market | TSE 1st Section |
Industry | Electric equipment (manufacturer) |
President and CEO | Isamu Oguni |
HQ Address | 5-8-12, Ogoto, Otsu, Shiga Prefecture |
Year-end | December |
Homepage |
Stock Information
Share Price | Shares Outstanding | Total market cap | ROE Act. | Trading Unit | |
1,628 | 37,735,784 shares | 61,433 million | 12.3% | 100 shares | |
DPS Est. | Dividend yield Est. | EPS Est. | PER Est. | BPS Act. | PBR Act. |
32.50 | 2.0% | 54.43 | 29.9 x | 875.98 | 1.9 x |
*The share price is the closing price on November 12. Shares Outstanding, DPS, EPS is based on the results in the third quarter of December in 2019. ROE and BPS are the values at the pervious term.
Earnings Trend
Fiscal Year | Sales | Operating profit | Ordinary profit | Net profit | EPS | DPS |
December 2015 | 27,793 | 3,161 | 3,222 | 2,051 | 61.98 | 20.00 |
December 2016 | 31,027 | 3,015 | 3,086 | 1,809 | 54.67 | 22.50 |
December 2017 | 37,504 | 4,885 | 5,036 | 3,386 | 97.63 | 27.50 |
December 2018 | 40,113 | 4,989 | 5,038 | 3,775 | 104.85 | 30.00 |
December 2019 Est. | 37,500 | 2,700 | 2,700 | 2,000 | 54.43 | 32.50 |
*The estimated values are from the company. Net profit is net profit attributed to parent shareholders. On April 1, 2018, a 2-for-1 stock split was implemented. Both EPS and DPS are revised retroactively.
This Bridge Report presents OPTEX GROUP’s earnings results for the third quarter of December, 2019
Table of Contents
Key Points
1. Company Overview
2. The Third Quarter of December 2019 Earnings Results
3. Fiscal Year Ending December 2019 Earnings Forecasts
4. Conclusions
<Reference: Regarding Corporate Governance>
Key Points
- The sales in the third quarter of the fiscal year ending December 2019 were 27,591 million yen, down 5.9% year on year. Sales dropped in all the 3 core businesses. A double-digit drop in sales was observed in the FA business, whose sales to SICK and China were sluggish. Domestic sales grew 0.5% year on year to 12,285 million yen, while overseas sales declined 10.4% year on year to 15,306 million yen. Operating profit dropped 50.0% year on year to 1,868 million yen. Decreasing of profit was thought to be affected by the following reasons. The effect of sales drop about 600 million yen, temporary cost increasing due to the factory relocation from China to Vietnam for products targeted at the U.S. market as a measure to dodge increased tariffs through the trade friction between the U.S. and China, the augmentation of cost for the product mix in the SS business, and the rise in SGA for the acquired subsidiary about 500 million yen.
- The full-year earnings forecast has been revised downwardly again. Sales are predicted to be affected by the sluggish sales of the SS business (security-related) in Europe and Asia, while profit will be affected by the drop in sales and the temporary rise in cost due to the relocation of the factory for products targeted at the U.S market. Sales are estimated to decrease 6.5% year on year to 37.5 billion yen. It is projected that domestic sales will decline 2.3% to 16.7 billion yen while overseas sales will drop 9.6% to 20.7 billion yen. Namely, it is forecasted that sales will decrease in Japan, and drop further outside the Japanese market. Operating profit is estimated to drop 45.9% year on year to 2.7 billion yen. There is no revision to the estimated dividends. The company plans to pay 32.50 yen/share, including the dividend for commemorating the 40th anniversary of establishment. The estimated payout ratio is 59.7%.
- The company expected that their business performance will recover in the second half term due to the recovery of sales of outdoor sensors in the SS business (security-related) in South Europe, the release of new models targeted at leading security companies in Japan, and the decrease in the cost rate due to local production getting on track. Nevertheless, unfortunately, the forecast has been revised downwardly again. The company is expected to grow from the mid/long-term viewpoint thanks to the expansion of IoT and investment for saving labor, distribution of image recognition systems in the security-related field, and so on. However, it is considered necessary to recover its profit steeply in the fourth quarter to attain the goal for this term. We would like to pay attention to how much sales and profit the company can generate overall.
1.Company Overview
OPTEX GROUP Co., Ltd. is a holding company centered around OPTEX Co., Ltd. that manufactures and sells outdoor sensors (top share of 40% in the global market), automatic door sensors (30% share of the global market and 50% share of the domestic market) and environment-related products.
OPTEX GROUP holds subsidiaries including OPTEX FA CO., LTD., which deals with FA related sensing business; CCS Inc., which holds the global top share in the LED lighting business for image processing; Three Ace Co., Ltd., which specializes in the development of various systems, applications, and digital content; Optex MFG Co., Ltd., which is responsible for manufacturing Group products, RAYTEC LIMITED (UK), which has attained the largest global share (about 50 %) for supplemental lights for CCTV; and FIBER SENSYS INC. (US), which deals with optical fiber intrusion detection systems.
OPTEX CO., LTD. | Develops and sells sensors for various uses, such as security sensors and sensors for automatic doors |
OPTEX FA CO., LTD. | Development and sales of photoelectric sensors, image inspection systems, displacement sensors and measuring instruments |
CCS Inc. | Development, manufacturing and sales of LED lighting devices, and systems for image processing |
THREE ACE CO., LTD. | Development of various systems, applications, and digital content |
OPTEX MFG CO., LTD. | Manufactures products for the Group and provides contract manufacturing service for electronic equipment |
SICK OPTEX CO., LTD. | Development of general-purpose photoelectric sensors. A joint venture of SICK AG (Germany) and OPTEX FA CO., LTD. |
GIKEN TRASTEM CO., LTD. | Development, manufacturing and sales of people counting systems, customer traffic counting/management systems |
ZENIC INC. | Contracted development of IC and LSI for image processing, and design and sales of FA systems |
O’PAL OPTEX CO., LTD. | Management of membership sports clubs and environmental hands-on learning programs |
FIBER SENSYS INC. (US) | Development, manufacturing and sales of fiber-optic intrusion detection systems |
FARSIGHT SECURITY SERVICES LTD. (UK) | Security company providing remote video surveillance services |
RAYTEC LIMITED. (UK) | Development, manufacturing and sales of supplemental lighting for surveillance cameras |
GARDASOFT VISION LIMITED. (UK) | Development, manufacturing, and sale of LED lighting controllers for machine vision |
1-1 Business Description
The Company’s business is composed of its main Sensing Solution (SS) business (security-related business and automatic door-related business), Factory Automation (FA) business (sensors for industrial machinery), Machine vision lightning (MVL) business (LED lighting device and system for image processing), “EMS business,” which was included in the SS business up until the previous term and provides contract manufacturing services for electronic equipment in China, and Other business (operation of sport clubs and development of applications and digital content).
Segment | Business Description | |
SS Business | Security-related | Main products include various indoor and outdoor sensors, wireless security systems and LED lighting control systems, etc. For outdoor sensors, the company has the leading share in the global market. Recently, it focuses on development of the automobile detection sensor using microwave technologies. |
Automatic door-related | The company developed the world’s first automatic door sensor using infrared rays. Main products are automatic door opening/closing sensors, shutter sensors for factories, wireless touch switches, etc. | |
Others | Equipment for measuring water quality. Manufacturing/marketing of measuring instruments, Transportation safety products, Customer traffic counting/management systems, developing/marketing of image processing-related products | |
FA Business | Main products include photoelectric sensors used for quality control and automation of production lines, displacement sensors, image sensors, LED lights, etc. In Japan, these products are provided to a wide range of industries such as food or pharmaceutical for quality control of production lines. In Europe, its products are sold broadly through its technological partner SICK AG (Germany) that has the largest share in industrial sensor market. Also, its house-brand products have been launched in Asia and North America. | |
MVL Business | The company has a significant share in the LED lighting business for image processing. The company offers solutions using the natural light LED developed by the company, which boasts the best color rendering property in the field. | |
EMS-related | Contract manufacturing services for electronic equipment, developed at a factory in China | |
Others | Operating sports clubs and development of applications and digital content. | |
1-2 Advantages: Diversified Technologies/Expertise on Sensing and Unique Sensing Algorithm
To produce stable and reliable sensors, it is essential to build on a number of elemental technologies and expertise, as well as “algorithms” to control physical changes. The company takes advantage of its technologies/expertise suitable for intended applications and its unique sensing algorithm to secure the largest share in the global market.
Noise abatement technology | ・Hardware design to minimize various noises ・Conduct a number of environmental assessments based on its own standard, and launch products that passed the assessments |
Sophisticated optical design | ・Make use of optical simulation to achieve high-density areas eliminating blind spots ・Packaging technologies to enable downsizing |
Compliant to public standards for reliability | ・Adapted and compliant to any global standards ・Adapted and compliant to industry standards and guidelines (CE marking, EN standard [TUV certified], ANSI, JIS, etc.) |
Environment friendly design | ・By identifying 15 restricted-use materials and 10 self-control materials, the company succeeded in excluding toxic substances in all products ・Compliant to RoHS directive, lead-free solder alloy ・Design to minimize the effect from CO2 when in use |
Secure & safe control | ・Adopt self-diagnosis functions in emergency or in failure to prevent system outage, and fail-safe devices for sensors ・Propose preventive maintenance measures to maintain functions |
Unique sensing algorithm | ・Unique algorithm to eliminate the impact of noise ineliminable by hardware, detect, scan and analyze only the intended events ・Various automatic correction functions to maintain performance in the field |
1-3 Corporate History
OPTEX was established in 1979 and developed the world's first automatic door sensors using infrared rays in the following year. Back then, most of the automatic doors were using pressure sensitive rubber mats, which contained sensors, and sensors using infrared rays were very innovative. The company also showed unrivaled abilities in product maintenance and implementation, and captured the top share in the automatic door sensors market in only three years since its foundation (currently, about 60% share in the domestic market). The company expanded operations and got listed on the over-the-counter market (equal to listing on JASDAQ) in 1991. Then it got listed on the second section of Tokyo Stock Exchange in 2001 and moved to its first section in 2003.
Recently, it has been working on enhancement of solutions based on image processing technologies and high-end security systems. In 2008, it acquired ZENIC INC., which specialized in contracted development of IC/LSI for image processing systems. Furthermore, it acquired FIBER SENSYS INC. (US) in 2010 and RAYTEC LIMITED (UK) in 2012, respectively. Also, CCS Inc. (6669, JASDAQ), which holds the largest market share in the world for LED lighting for image processing, was reorganized into a subsidiary in May 2016 (and became a wholly owned subsidiary in July 2018). On January 1, 2017, the company shifted to the holding company system, with the aim of advancing to next-generation management and pursuing group synergy.
1-4 ROE analysis
| FY 12/ 11 | FY 12/ 12 | FY 12/ 13 | FY 12/ 14 | FY 12/ 15 | FY 12/ 16 | FY 12/ 17 | FY 12/ 18 |
ROE(%) | 6.0 | 4.6 | 8.2 | 8.6 | 8.7 | 7.4 | 12.6 | 12.3 |
Net profit margin (%) | 5.58 | 3.99 | 6.87 | 7.39 | 7.38 | 5.83 | 9.03 | 9.41 |
Total asset turnover [times](x) | 0.85 | 0.91 | 0.92 | 0.89 | 0.91 | 0.91 | 0.95 | 0.95 |
Leverage [times](x) | 1.27 | 1.28 | 1.30 | 1.31 | 1.30 | 1.41 | 1.48 | 1.38 |
ROE in FY December 2018 achieved “10% or more” as targeted for two consecutive terms. Net profit margin for the current fiscal year is projected to be 6.3%. It is expected that the high ROE will continue due to accumulation of profits even if total assets and capital increase.
1-5 Efforts on ESG
The company actively responds to ESG issues and strives to improve corporate value.
E: Environment | In the SS business (automatic door-related), the company develops and sells the “e-Smooth Sensor” which is an automatic door sensor that controls unnecessary opening. This product improves the air conditioning efficiency of the building and reduces electricity consumption by about 30%. In the SS business (water quality measurement-related), the company has developed and marketed products to measure water quality such as turbidity. These products, which enable water quality management using IoT, contribute to global warming countermeasures globally. |
S: Society | The company’s head office is located by Lake Biwa. Taking advantage of its location, one of its subsidiaries, O'PAL OPTEX Co., Ltd. implements the “Lake Biwa Active Learning Program” as part of social contribution activities. Approximately 10,000 people participate annually to experience sports such as canoes and learn the water environment such as lakeside creatures. |
G: Governance | To enhance the quality of strategies through active discussions at the Board of Directors and realize further enhancement of corporate value, the company appoints external directors with diverse backgrounds and skills. In addition, there are four independent external directors accounting for more than one-third of the 11 directors and auditors. They constitute a management structure that balances management functions and monitoring functions of management. |
2.The Third Quarter of December 2019 Earnings Results
(1)Business Results
| FY 12/18 3Q | Ratio to sales | FY 12/19 3Q | Ratio to sales | YoY |
Sales | 29,314 | 100.0% | 27,591 | 100.0% | -5.9% |
Gross profit | 16,366 | 55.8% | 14,868 | 53.9% | -9.2% |
SG&A | 12,628 | 43.1% | 13,000 | 47.1% | +2.9% |
Operating profit | 3,737 | 12.7% | 1,868 | 6.8% | -50.0% |
Ordinary profit | 3,785 | 12.9% | 1,814 | 6.6% | -52.1% |
Net Profit | 2,794 | 9.5% | 1,355 | 4.9% | -51.5% |
*Unit: million yen. The Net profit is the profit attributable to owners of the parent company. The same shall apply hereinafter.
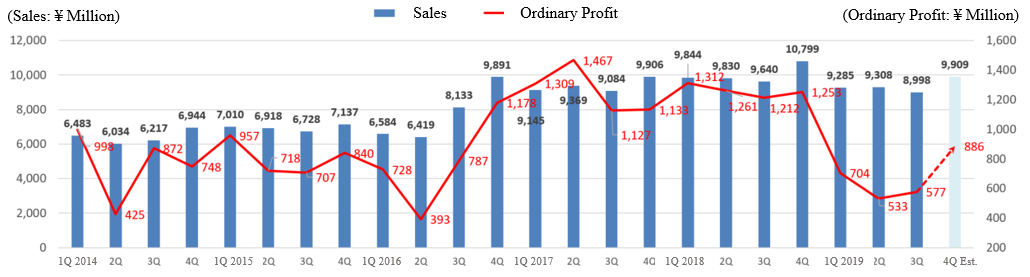
Sales and profit decreased.
The sales in the third quarter of the fiscal year ending December 2019 were 27,591 million yen, down 5.9% year on year. Sales dropped in all the 3 core businesses. A double-digit drop in sales was observed in the FA business, whose sales to SICK and China were sluggish. Domestic sales grew 0.5% year on year to 12,285 million yen, while overseas sales declined 10.4% year on year to 15,306 million yen. Operating profit dropped 50.0% year on year to 1,868 million yen. Decreasing of profit was thought to be affected by the following reasons. The effect of sales drop about 600 million yen, temporary cost increasing due to the factory relocation from China to Vietnam for products targeted at the U.S. market as a measure to dodge increased tariffs increased through the trade friction between the U.S. and China, the augmentation of cost for the product mix in the SS business, and the rise in SGA for the acquired subsidiary about 500 million yen.
◎Average exchange rate
| FY 12/18 3Q | FY 12/19 3Q |
USD | 109.61 | 109.15 |
GBP | 148.24 | 139.05 |
EURO | 130.97 | 122.66 |
(2)Earnings by Segment
①Trends in each segment and region
| FY 12/18 3Q | Ratio to sales | FY 12/19 3Q | Ratio to sales | YoY |
SS Business | 15,434 | 52.7% | 14,518 | 52.6% | -5.9% |
FA Business | 6,412 | 21.9% | 5,302 | 19.2% | -17.3% |
MVL Business | 6,942 | 23.7% | 6,894 | 25.0% | -0.7% |
EMS Business | 358 | 1.2% | 444 | 1.6% | +24.0% |
Others | 167 | 0.6% | 430 | 1.6% | +157.5% |
Sales | 29,314 | 100.0% | 27,591 | 100.0% | -5.9% |
SS Business | 1,929 | 12.5% | 1,124 | 7.7% | -41.7% |
FA Business | 1,052 | 16.4% | 424 | 8.0% | -59.7% |
MVL Business | 731 | 10.5% | 387 | 5.6% | -47.1% |
EMS Business | 215 | 60.1% | -6 | - | - |
Others | 7 | 4.2% | 18 | 4.2% | +157.1% |
Adjustments | -197 | - | -80 | - | - |
Operating profit | 3,737 | 12.7% | 1,868 | 6.8% | -50.0% |
*Unit: million yen. Ratio to sales of Operating profit refers to Sales Profit margin.
②Trends in each segment and region
| FY 12/18 3Q | Ratio to sales | FY 12/19 3Q | Ratio to sales | YoY |
SS: Security | 10,542 | 100.0% | 9,686 | 100.0% | -8.1% |
Japan | 1,566 | 14.9% | 1,704 | 17.6% | +8.8% |
AMERICAs | 2,262 | 21.5% | 1,972 | 20.4% | -12.8% |
EMEA | 5,508 | 52.2% | 5,034 | 52.0% | -8.6% |
Asia | 1,206 | 11.4% | 976 | 10.1% | -19.1% |
|
|
|
|
|
|
SS: Automatic door | 3,270 | 100.0% | 3,272 | 100.0% | +0.1% |
Japan | 1,666 | 50.9% | 1,631 | 49.8% | -2.1% |
AMERICAs | 807 | 24.7% | 878 | 26.8% | +8.8% |
EMEA | 682 | 20.9% | 670 | 20.5% | -1.8% |
Asia | 115 | 3.5% | 93 | 2.8% | -19.1% |
|
|
|
|
|
|
SS: Other | 1,622 | 100.0% | 1,560 | 100.0% | -3.8% |
Japan | 1,372 | 84.6% | 1,356 | 86.9% | -1.2% |
Asia | 250 | 15.4% | 203 | 13.0% | -18.8% |
|
|
|
|
|
|
FA | 6,412 | 100.0% | 5,303 | 100.0% | -17.3% |
Japan | 2,752 | 42.9% | 2,601 | 49.0% | -5.5% |
AMERICAs | 88 | 1.4% | 81 | 1.5% | -8.0% |
EMEA | 2,422 | 37.8% | 1,704 | 32.1% | -29.6% |
Asia | 1,150 | 17.9% | 917 | 17.3% | -20.3% |
|
|
|
|
|
|
MVL | 6,942 | 100.0% | 6,895 | 100.0% | -0.7% |
Japan | 4,609 | 66.4% | 4,367 | 63.3% | -5.3% |
AMERICAs | 583 | 8.4% | 618 | 9.0% | +6.0% |
EMEA | 911 | 13.1% | 1,074 | 15.6% | +17.9% |
Asia | 839 | 12.1% | 836 | 12.1% | -0.4% |
|
|
|
|
|
|
EMS Business | 358 | 100.0% | 444 | 100.0% | +24.0% |
Japan | 91 | 25.4% | 195 | 43.9% | +114.3% |
Asia/Oceania | 267 | 74.6% | 249 | 56.1% | -6.7% |
*Unit: million yen.
◎SS Business
(Security-related)
Japan :Sales increased as the sales of the outdoor security sensors for security companies and important large-scale facilities such as airports were healthy.
AMERICAs : Sales dropped due to the sluggish sales of sensors for important large-scale facilities in Latin America.
EMEA :Sales decreased as the sales of the sensors for general residence in Southern Europe region by the sales subsidiary in the U.K. were sluggish.
Asia : Sales declined due to the sluggish sales of security sensors by a Korean subsidiary that distributes the products of Optex.
(Automatic door-related)
Japan :Sales decreased as the sales of the sensors of automatic doors for major domestic customers were sluggish.
AMERICAs : Sales increased due to the steady sale of automatic door sensors targeted at major clients in North America.
EMEA : While the sales of automatic door sensors targeted at major clients in Europe had been steady, sales decreased due to fluctuation of exchange rates.
◎FA Business
Japan :Sales declined as the growth of sales of the products for semiconductor, rechargeable battery and electronic parts-related industries was sluggish, while sales were steady for automobile-related industries.
EMEA :Sales dropped as the sales of the products to OEM were stagnant due to declining business confidence of the world’s economy.
Asia:Sales decreased due to the sluggish growth of sales of displacement sensors as a result of deceleration of demand for capital investment caused by economic slowdown in China.
The business was considerably affected by the ongoing problems between the U.S. and China.
Decline in the sales quantity of displacement sensors which have high margin also resulted in the decrease of profit.
◎MVL lighting business
Japan : Sales declined due to the lingering curtailment of investments on semiconductors and smartphones caused by the prolongation of the trade friction between the U.S. and China.
AMERICAs : Sales grew due to the increase of projects along with transactions from not only existing customers but also new customers.
EMEA :A French LED lighting manufacturer for image inspection, which was made into a subsidiary in the fourth quarter in 2018, contributed to increased sales.
Asia:Sales remained flat as the growth of sales by the local subsidiaries was stagnant due to deceleration in demand for capital investment in China.
The total Sales dropped, but the sales of UV-related sensors rose in performance.
The company is actively investing in testing rooms to strengthen solution providing capability.
(3)Financial Conditions and Cash Flow
◎Main BS
| End of Dec.2018 | End of Sep.2019 |
| End of Dec.2018 | End of Sep.2019 |
Current Assets | 29,530 | 28,444 | Current liabilities | 6,470 | 7,694 |
Cash | 11,563 | 11,082 | Payables | 1,997 | 1,685 |
Receivables | 8,938 | 8,132 | LT Interest Bearing Liabilities | 1,409 | 3,365 |
Inventories | 7,339 | 7,397 | Noncurrent liabilities | 4,477 | 3,625 |
Noncurrent Assets | 13,760 | 14,325 | ST Interest Bearing Liabilities | 1,706 | 562 |
Tangible Assets | 4,678 | 5,545 | Net defined benefit liabilities | 1,219 | 1,216 |
Intangible Assets | 4,243 | 3,955 | Liabilities | 10,945 | 11,319 |
Investment, Others | 4,837 | 4,824 | Net Assets | 32,345 | 31,450 |
Total assets | 43,291 | 42,770 | Total Liabilities and Net Assets | 43,291 | 42,770 |
*Unit: million yen
Total assets were 42,770 million yen, down 521 million yen from the end of the previous year, due to the decrease in cash & deposits and receivables.
Total liabilities were 11,319 million yen, up 374 million yen from the end of the previous year, due to the increase in short-term debts, etc.
Net assets were 31,450 million yen, down 895 million yen from the end of the previous year due to the increase of treasury shares, etc.
Capital-to-asset ratio dropped 1.3 points to 73.2%.
(4)Topics
◎Acquisition of treasury shares
The details of accumulated treasury shares acquired on October 31, 2019. based on the resolution of the board of directors on August 5, 2019 is shown as follows.
Amount | 990 million yen (Maximum: 1 billion yen) |
No. of shares | 666,500 (Maximum: 800,000) |
3.Fiscal Year ending December 2019 Earnings Forecasts
(1)Business Results
| FY 12/18 | Ratio to sales | FY 12/19 Est. | Ratio to sales | YoY | Revision rate | Progress rate |
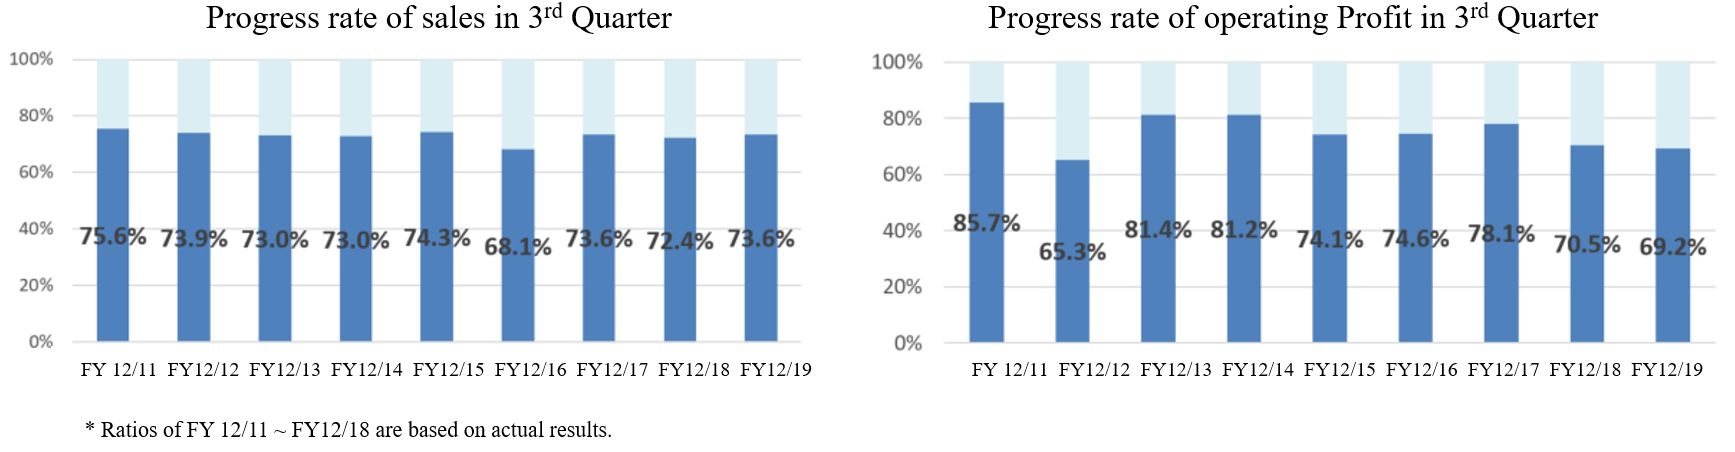
Sales | 40,113 | 100.0% | 37,500 | 100.0% | -6.5% | -6.3% | 73.6% |
Operating profit | 4,989 | 12.4% | 2,700 | 7.2% | -45.9% | -20.6% | 69.2% |
Ordinary profit | 5,038 | 12.6% | 2,700 | 7.2% | -46.4% | -20.6% | 67.2% |
Net profit | 3,775 | 9.4% | 2,000 | 5.3% | -47.0% | -20.0% | 67.8% |
*Unit: million yen. Ratio to sales equals to Sales Profit margin.
Performance forecast was revised downward again.
The full-year earnings forecast has been revised downwardly again. Sales are predicted to be affected by the sluggish sales of the SS business (security-related) in Europe and Asia, while profit will be affected by the drop in sales and the temporary rise in cost due to the relocation of the factory for products targeted at the U.S. market. Sales are estimated to decrease 6.5% year on year to 37.5 billion yen. It is projected that domestic sales will decline 2.3% to 16.7 billion yen while overseas sales will drop 9.6% to 20.7 billion yen. Namely, it is forecasted that sales will decrease in Japan, and drop further outside the Japanese market. Operating profit is estimated to drop 45.9% year on year to 2.7 billion yen. There is no revision to the estimated dividends. The company plans to pay 32.50 yen/share, including the dividend for commemorating the 40th anniversary of establishment. The estimated payout ratio is 59.7%.
(2)Trends in each segment and region
| FY 12/18 | Ratio to sales | FY 12/19 Est. | Ratio to sales | YoY | Revision rate | Progress rate |
SS: Security | 14,382 | 100.0% | 13,087 | 100.0% | -9.0% | -8.3% | 74.0% |
Japan | 2,377 | 16.5% | 2,414 | 18.4% | +1.6% | -9.2% | 70.6% |
AMERICAs | 2,991 | 20.8% | 2,660 | 20.3% | -11.1% | -9.3% | 74.1% |
EMEA | 7,407 | 51.5% | 6,665 | 50.9% | -10.0% | -6.3% | 75.5% |
Asia | 1,607 | 11.2% | 1,348 | 10.3% | -16.1% | -13.6% | 72.4% |
|
|
|
|
|
|
|
|
SS: Automatic door | 4,455 | 100.0% | 4,548 | 100.0% | +2.1% | -3.3% | 71.9% |
Japan | 2,308 | 51.8% | 2,290 | 50.4% | -0.8% | -2.9% | 71.2% |
AMERICAs | 1,099 | 24.7% | 1,181 | 26.0% | +7.5% | -4.5% | 74.3% |
EMEA | 896 | 20.1% | 910 | 20.0% | +1.6% | -6.1% | 73.6% |
Asia | 152 | 3.4% | 167 | 3.7% | +9.9% | +19.3% | 55.7% |
|
|
|
|
|
|
|
|
SS: Other | 2,320 | 100.0% | 2,246 | 100.0% | -3.2% | -9.8% | 69.5% |
Japan | 1,952 | 84.1% | 1,835 | 81.7% | -6.0% | -10.4% | 73.9% |
Asia | 368 | 15.9% | 410 | 18.3% | +11.4% | -6.8% | 49.5% |
|
|
|
|
|
|
|
|
FA | 8,548 | 100.0% | 7,111 | 100.0% | -16.8% | -6.5% | 74.6% |
Japan | 3,763 | 44.0% | 3,529 | 49.6% | -6.2% | +0.5% | 73.7% |
AMERICAs | 123 | 1.4% | 130 | 1.8% | +5.7% | -19.3% | 62.3% |
EMEA | 3,218 | 37.6% | 2,048 | 28.8% | -36.4% | -17.3% | 83.2% |
Asia | 1,444 | 16.9% | 1,404 | 19.7% | -2.8% | -3.6% | 65.3% |
|
|
|
|
|
|
|
|
MVL | 9,485 | 100.0% | 9,378 | 100.0% | -1.1% | -3.9% | 73.5% |
Japan | 6,207 | 65.4% | 5,862 | 62.5% | -5.6% | +0.2% | 74.5% |
AMERICAs | 796 | 8.4% | 848 | 9.0% | +6.5% | -6.4% | 72.9% |
EMEA | 1,342 | 14.1% | 1,541 | 16.4% | +14.8% | -16.7% | 69.7% |
Asia | 1,140 | 12.0% | 1,127 | 12.0% | -1.1% | -2.3% | 74.2% |
|
|
|
|
|
|
|
|
EMS Business | 565 | 100.0% | 557 | 100.0% | -1.4% | -5.6% | 79.7% |
Japan | 194 | 34.3% | 256 | 46.0% | +32.0% | +51.5% | 76.2% |
Asia/Oceania | 371 | 65.7% | 301 | 54.0% | -18.9% | -28.5% | 82.7% |
*Unit: million yen.
4.Conclusions
The company expected that their business performance will recover in the second half term due to the recovery of sales of outdoor sensors in the SS business (security-related) in South Europe, the release of new models targeted at leading security companies in Japan, and the decrease in cost rate due to local production getting on track. Nevertheless, unfortunately, the forecast has been revised downwardly again. The company is expected to grow from the mid/long-term viewpoint thanks to the expansion of IoT and investment for saving labor, distribution of image recognition systems in the security-related field, and so on. However, it is considered necessary to recover its profit steeply in the fourth quarter in order to attain the goal for this term. We would like to pay attention to how much sales and profit the company can generate overall.
<Reference: Regarding Corporate Governance>
◎Organization type, and the composition of directors and auditors
Organization type | Company with audit and supervisory committee |
Directors | 11directors, including 4 outside ones |
◎Corporate Governance Report
The latest revision date: March 28, 2019
<Fundamental concept>
As the Group, we recognize that it is our greatest mission to continuously improve corporate value while earning the trust of our shareholders, investors, customers and society. To practice it, we consider enhancement of the corporate governance as one of important management tasks and aim to improve the transparency of management, maintain management systems accompanying fair and prompt decision making and strengthen management monitoring function.
<Reasons for Non-compliance with the Principles of the Corporate Governance Code (Excerpts)>
Principle | Items to be disclosed |
[Supplementary Principle 4-11-1. Balance, diversity and scale of the Board of Directors as a whole] | We have been electing candidates for directors without regard to sex and nationality, and, consequently, we have never appointed female or foreign directors so far. However, our company’s Board of Directors is composed of 7 (maximum number is set at 9) directors (not audit committee members), who effectively utilize their expertise in business management/administration, technological development, production, sales, overseas work experience, accounting and legal work, and 4 directors (maximum number is 4), who are audit committee members with distinguished insight and knowledge, having management or auditing experience at a major company or possessing qualifications of a certified public accountant, a licensed tax accountant, or the like and we consider that the current composition is balanced to pursue our medium-to-long-term management plan, taking the scale of our company and our corporate group into consideration. We will continue to examine optimization for the balance of diversity and expertise. |
<Disclosure Based on the Principles of the Corporate Governance Code (Excerpts)>
Principle | Items to be disclosed |
Principle 1-4 The strategically held shares
| The company will acquire and hold shares after the board of directors’ deliberations and decision-making being processed only when it is judged that the holding of shares would contribute to strengthening of transaction relations and the improvement in corporate value in the business strategy of our corporate group. Every year, the board of directors discusses the meanings of the holding of the shares, and if it is judged that the reasonable value of the shareholding is insufficient, the company will sell the shares while considering the market trend, etc. As for the exercise of the voting rights of shares the company holds, there are no specific standards, but each bill will be discussed, and dealt with based on comprehensive judgment. Listed cross-shareholdings owned by the company: 1 brand, 34 million yen (posted on the balance sheet)
Regarding the exercise of voting rights for the shares, we will individually examine whether it will contribute to sustainable growth of the enterprise and enhance corporate value over the medium to long term as well as whether shareholder value is not significantly impaired. Based on the examination, we will decide approval or rejection of it in a comprehensive manner |
Principle 5-1 Policy for the constructive dialogues with shareholders | The company has the publicity and IR sections, and makes efforts to explain its managerial policy and situation in an understandable manner, so that it can talk with shareholders proactively and constructively. In addition, IR staff and officers hold briefing sessions for institutional and individual investors as planned, and respond to the request for an interview from institutional investors. In addition, each annual meeting of shareholders is held on Saturday, so that a broad range of shareholders can attend, and after the meeting, the company holds a briefing session and a convivial party for shareholders, so that they can understand the policy of the company. In addition, last year, the venue of the general meeting of shareholders was changed to a hotel located inside the JR Kyoto Station building, in order to make it more convenient for shareholders to participate. |
This report is intended solely for information purposes, and is not intended as a solicitation to invest in the shares of this company. The information and opinions contained within this report are based on data made publicly available by the Company, and comes from sources that we judge to be reliable. However, we cannot guarantee the accuracy or completeness of the data. This report is not a guarantee of the accuracy, completeness or validity of said information and or opinions, nor do we bear any responsibility for the same. All rights pertaining to this report belong to Investment Bridge Co., Ltd., which may change the contents thereof at any time without prior notice. All investment decisions are the responsibility of the individual and should be made only after proper consideration. Copyright(C) 2019, All Rights Reserved by Investment Bridge Co., Ltd. |