Bridge Report:(6914)OPTEX GROUP the second quarter of fiscal year Ending December 2020
![]()
 Isamu Oguni President and CEO | OPTEX GROUP (6914) |
 |
Company Information
Market | TSE 1st Section |
Industry | Electric equipment (manufacturer) |
President and CEO | Isamu Oguni |
HQ Address | 4-7-5, Nionohama, Otsu, Shiga Prefecture |
Year-end | December |
Homepage |
Stock Information
Share Price | Shares Outstanding | Total market cap | ROE Act. | Trading Unit | |
¥1,295 | 37,735,784 shares | ¥48,867 million | 6.8% | 100 shares | |
DPS Est. | Dividend yield Est. | EPS Est. | PER Est. | BPS Act. | PBR Act. |
¥30.00 | 2.3% | ¥33.19 | 39.0x | ¥891.06 | 1.5x |
*The share price is the closing price on August 24. Shares outstanding, EPS and DPS are from the second quarter financial report. ROE and BPS
are the actual values as of the end of the previous fiscal year.
Earnings Trend
Fiscal Year | Sales | Operating profit | Ordinary profit | Net profit | EPS | DPS |
December 2016 | 31,027 | 3,015 | 3,086 | 1,809 | 54.67 | 22.50 |
December 2017 | 37,504 | 4,885 | 5,036 | 3,386 | 97.63 | 27.50 |
December 2018 | 40,113 | 4,989 | 5,038 | 3,775 | 104.85 | 30.00 |
December 2019 | 37,517 | 2,856 | 2,876 | 2,197 | 60.02 | 32.50 |
December 2020 Est. | 34,500 | 1,800 | 2,000 | 1,200 | 33.19 | 30.00 |
* Net profit is net profit attributed to parent shareholders. On April 1, 2018, a 2-for-1 stock split was implemented. Both EPS and DPS are revised retroactively.
This Bridge Report presents OPTEX GROUP’s earnings results for the second quarter of fiscal year Ending December 2020 and so on.
Table of Contents
Key Points
1. Company Overview
2. The Second Quarter of Fiscal Year Ending December 2020 Earnings Results
3. Fiscal Year Ending December 2020 Earnings Forecasts
4. Growth Strategy
5. Conclusions
<Reference: Regarding Corporate Governance>
Key Points
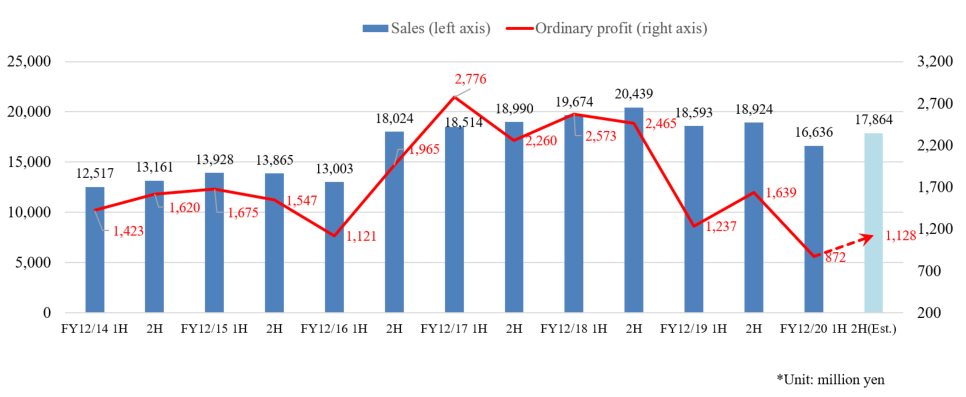
- The sales for the second quarter of the fiscal year ending December 2020 were 16,636 million yen, down 10.5% year on year. Business activities were stagnated due to city lockdowns, movement restrictions, etc. caused by the global spread of COVID-19. Sales dropped in all segments. Domestic business sales declined 3.9% year on year to 7,761 million yen, and overseas business sales decreased 15.6% year on year to 8,875 million yen. The sales in Europe, which is the company’s main market, were significantly affected, resulting in a 20% decline in sales. Operating profit fell 40.4% year on year to 783 million yen. SG&A expenses declined 6.1% year on year. Nonetheless, the company was unable to absorb the impact of the decline in sales.
- On July 13, OPTEX announced the full-year forecast for the fiscal year ending December 2020, which was once left undecided. Sales are expected to drop 8.0% year on year to 34.5 billion yen, and operating profit is estimated to decline 37.0% to 1.8 billion yen. The sales loss of SS business will improve compared with the first half. The FA business is expected to recover, mainly in Europe and China, and to increase sales. On an ordinary dividend basis, the dividend is to be 30.00 yen/share, unchanged from the previous year. The expected payout ratio is 90.4%.
- COVID-19 significantly affected the performance in the first half of the current year. The company expects a recovery in the second half, despite a decline in sales and profits for the full year. Among the company’s segments, the FA business is expected to exceed the previous year’s earnings due to the recovery in Europe in the second half in addition to China in the first half. Also, the expansion of “non-contact demand” during the pandemic in the SS business (automatic doors) may become a long-term theme.
- On the other hand, it seems that it will take a little longer for the recovery of the outdoor security sensors in Europe, which have been driving growth so far. This will determine whether OPTEX can get into a full-scale recovery path. We would also like to pay attention to the progress of the “image confirmation solutions,” which would be the core of the business model reform.
1. Company Overview
OPTEX GROUP Co., Ltd. is a holding company centered around OPTEX Co., Ltd. that manufactures and sells outdoor sensors (top share of 40% in the global market), automatic door sensors (30% share of the global market and 50% share of the domestic market) and environment-related products.
OPTEX GROUP holds subsidiaries including OPTEX FA CO., LTD., which deals with FA related sensing business; CCS Inc., which holds the global top share in the LED lighting business for image processing; Three Ace Co., Ltd., which specializes in the development of various systems, applications, and digital content; Optex MFG Co., Ltd., which is responsible for manufacturing Group products, RAYTEC LIMITED (UK), which has attained the largest global share (about 50 %) for supplemental lights for CCTV; and FIBER SENSYS INC. (US), which deals with optical fiber intrusion detection systems.
As of December 31, 2019, the company operates in 80 locations worldwide, including 26 overseas companies.
OPTEX CO., LTD. | Develops and sells sensors for various uses, such as security sensors and sensors for automatic doors |
OPTEX FA CO., LTD. | Development and sales of photoelectric sensors, image inspection systems, displacement sensors and measuring instruments |
CCS Inc. | Development, manufacturing and sales of LED lighting devices, and systems for image processing |
THREE ACE CO., LTD. | Development of various systems, applications, and digital content |
OPTEX MFG CO., LTD. | Manufactures products for the Group and provides contract manufacturing service for electronic equipment |
SICK OPTEX CO., LTD. | Development of general-purpose photoelectric sensors. A joint venture of SICK AG (Germany) and OPTEX FA CO., LTD. |
GIKEN TRASTEM CO., LTD. | Development, manufacturing and sales of people counting systems, customer traffic counting/management systems |
ZENIC INC. | Contracted development of IC and LSI for image processing, and design and sales of FA systems |
O’PAL OPTEX CO., LTD. | Management of membership sports clubs and environmental hands-on learning programs |
FIBER SENSYS INC. (US) | Development, manufacturing and sales of fiber-optic intrusion detection systems |
FARSIGHT SECURITY SERVICES LTD. (UK) | Security company providing remote video surveillance services |
RAYTEC LIMITED. (UK) | Development, manufacturing and sales of supplemental lighting for surveillance cameras |
GARDASOFT VISION LIMITED. (UK) | Development, manufacturing, and sale of LED lighting controllers for machine vision |
1-1 Business Description
The Company’s business is composed of its main Sensing Solution (SS) business (security-related business and automatic door-related business), Factory Automation (FA) business (sensors for industrial machinery), Machine vision lightning (MVL) business (LED lighting device and system for image processing), “EMS business,” which was included in the SS business up until the previous term and provides contract manufacturing services for electronic equipment in China, and Other business (operation of sport clubs and development of applications and digital content).
Segment | Business Description | |
SS Business | Security-related | Main products include various indoor and outdoor sensors, wireless security systems and LED lighting control systems, etc. For outdoor sensors, the company has the leading share in the global market. Recently, it focuses on development of the automobile detection sensor using microwave technologies. |
Automatic door-related | The company developed the world’s first automatic door sensor using infrared rays. Main products are automatic door opening/closing sensors, shutter sensors for factories, wireless touch switches, etc. | |
Others | Equipment for measuring water quality. Manufacturing/marketing of measuring instruments, Transportation safety products, Customer traffic counting/management systems, developing/marketing of image processing-related products | |
FA Business | Main products include photoelectric sensors used for quality control and automation of production lines, displacement sensors, image sensors, LED lights, etc. In Japan, these products are provided to a wide range of industries such as food or pharmaceutical for quality control of production lines. In Europe, its products are sold broadly through its technological partner SICK AG (Germany) that has the largest share in industrial sensor market. Also, its house-brand products have been launched in Asia and North America. | |
MVL Business | The company has a significant share in the LED lighting business for image processing. The company offers solutions using the natural light LED developed by the company, which boasts the best color rendering property in the field. | |
EMS-related | Contract manufacturing services for electronic equipment, developed at a factory in China | |
Others | Operating sports clubs and development of applications and digital content. | |
1-2 Advantages: Diversified Technologies/Expertise on Sensing and Unique Sensing Algorithm
To produce stable and reliable sensors, it is essential to build on a number of elemental technologies and expertise, as well as “algorithms” to control physical changes. The company takes advantage of its technologies/expertise suitable for intended applications and its unique sensing algorithm to secure the largest share in the global market.
Noise abatement technology | ・Hardware design to minimize various noises ・Conduct a number of environmental assessments based on its own standard, and launch products that passed the assessments |
Sophisticated optical design | ・Make use of optical simulation to achieve high-density areas eliminating blind spots ・Packaging technologies to enable downsizing |
Compliant to public standards for reliability | ・Adapted and compliant to any global standards ・Adapted and compliant to industry standards and guidelines (CE marking, EN standard [TUV certified], ANSI, JIS, etc.) |
Environment friendly design | ・By identifying 15 restricted-use materials and 10 self-control materials, the company succeeded in excluding toxic substances in all products ・Compliant to RoHS directive, lead-free solder alloy ・Design to minimize the effect from CO2 when in use |
Secure & safe control | ・Adopt self-diagnosis functions in emergency or in failure to prevent system outage, and fail-safe devices for sensors ・Propose preventive maintenance measures to maintain functions |
Unique sensing algorithm | ・Unique algorithm to eliminate the impact of noise ineliminable by hardware, detect, scan and analyze only the intended events ・Various automatic correction functions to maintain performance in the field |
1-3 Corporate History
OPTEX was established in 1979 and developed the world's first automatic door sensors using infrared rays in the following year. Back then, most of the automatic doors were using pressure sensitive rubber mats, which contained sensors, and sensors using infrared rays were very innovative. The company also showed unrivaled abilities in product maintenance and implementation, and captured the top share in the automatic door sensors market in only three years since its foundation (currently, about 60% share in the domestic market). The company expanded operations and got listed on the over-the-counter market (equal to listing on JASDAQ) in 1991. Then it got listed on the second section of Tokyo Stock Exchange in 2001 and moved to its first section in 2003.
Recently, it has been working on enhancement of solutions based on image processing technologies and high-end security systems. In 2008, it acquired ZENIC INC., which specialized in contracted development of IC/LSI for image processing systems. Furthermore, it acquired FIBER SENSYS INC. (US) in 2010 and RAYTEC LIMITED (UK) in 2012, respectively. Also, CCS Inc. (6669, JASDAQ), which holds the largest market share in the world for LED lighting for image processing, was reorganized into a subsidiary in May 2016 (and became a wholly owned subsidiary in July 2018). On January 1, 2017, the company shifted to the holding company system, with the aim of advancing to next-generation management and pursuing group synergy.
1-4 ROE analysis
| FY 12/ 11 | FY 12/ 12 | FY 12/ 13 | FY 12/ 14 | FY 12/ 15 | FY 12/ 16 | FY 12/ 17 | FY 12/ 18 | FY 12/ 19 |
ROE (%) | 6.0 | 4.6 | 8.2 | 8.6 | 8.7 | 7.4 | 12.6 | 12.3 | 6.8 |
Net profit margin (%) | 5.58 | 3.99 | 6.87 | 7.39 | 7.38 | 5.83 | 9.03 | 9.41 | 5.86 |
Total asset turnover (times) | 0.85 | 0.91 | 0.92 | 0.89 | 0.91 | 0.91 | 0.95 | 0.95 | 0.86 |
Leverage (times) | 1.27 | 1.28 | 1.30 | 1.31 | 1.30 | 1.41 | 1.48 | 1.38 | 1.35 |
The company sets the target ROE: “10% or higher.”
1-5 Efforts on ESG
The company believes that building a relationship of trust with a wide range of stakeholders is essential for improving corporate value and has posted 「ESG information」(https://www.optexgroup.co.jp/en/esg/stakeholder.html)on its website to further enhance ESG information disclosure. In addition, Published the ESG Bridge Report through Investment Bridge Inc. The company identify the materiality for sustainable growth, mention the challenges and initiatives for the future in the report.
https://www.bridge-salon.jp/report_bridge/archives/eng/6914/20200609.html
2. The Second Quarter of Fiscal Year Ending December 2020 Earnings Results
(1) Business Results
| FY 12/19 2Q | Ratio to sales | FY 12/20 2Q | Ratio to sales | YoY |
Sales | 18,593 | 100.0% | 16,636 | 100.0% | -10.5% |
Gross profit | 10,040 | 54.0% | 8,974 | 53.9% | -10.6% |
SG&A | 8,725 | 46.9% | 8,190 | 49.2% | -6.1% |
Operating profit | 1,315 | 7.1% | 783 | 4.7% | -40.4% |
Ordinary profit | 1,237 | 6.7% | 872 | 5.2% | -29.5% |
Net Profit | 923 | 5.0% | 586 | 3.5% | -36.5% |
*Unit: million yen. The Net profit is the profit attributable to owners of the parent company. The same shall apply hereinafter.
Sales and profit declined
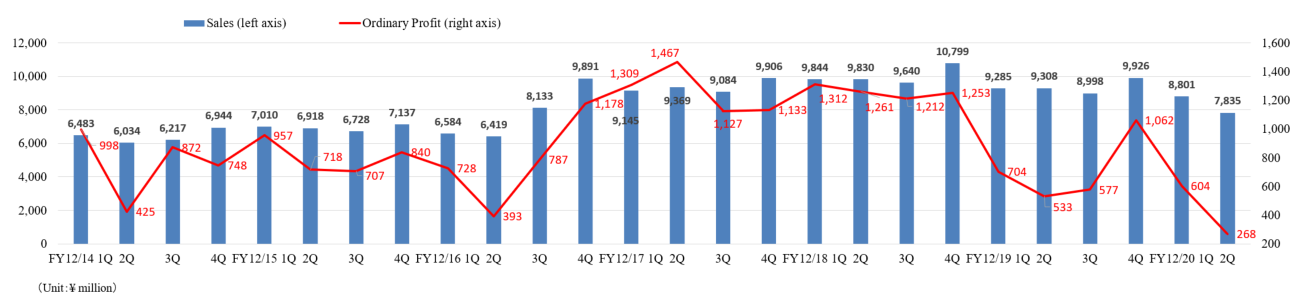
The sales in the second quarter of fiscal year ending December 2020 were 16,636 million yen, down 10.5% year on year. Sales declined in all segments due to sluggish sales activities caused by city closures and movement restrictions due to the global spread of COVID-19. Domestic sales declined 3.9% YoY to 7.761 billion yen, and overseas sales were down 15.6% YoY to 8.875 billion yen. The sales in Europe, which is the company’s main market, were significantly affected, resulting in a 20% decline in sales.
Operating profit was down 40.4% YoY to 783 million yen. SG&A expenses were down 6.1% YoY, but this was not enough to absorb the impact of the decline in sales.
◎Trends in each quarter
◎Regional trends
| FY 12/19 2Q | Ratio to sales | FY 12/20 2Q | Ratio to sales | YoY |
Sales | 18,593 | 100.0% | 16,636 | 100.0% | -10.5% |
Domestic | 8,072 | 43.4% | 7,761 | 46.7% | -3.9% |
Overseas | 10,521 | 56.6% | 8,875 | 53.3% | -15.6% |
America | 2,393 | 12.9% | 2,052 | 12.3% | -14.2% |
Europe | 5,907 | 31.8% | 4,734 | 28.5% | -19.9% |
Asia | 2,221 | 11.9% | 2,089 | 12.6% | -5.9% |
◎Average exchange rate
| FY 12/19 2Q | FY 12/20 2Q |
USD | ¥110.05 | ¥108.27 |
EURO | ¥124.32 | ¥119.30 |
(2) Earnings by Segment
①Trends in each segment
| FY 12/19 2Q | Ratio to sales | FY 12/20 2Q | Ratio to sales | YoY |
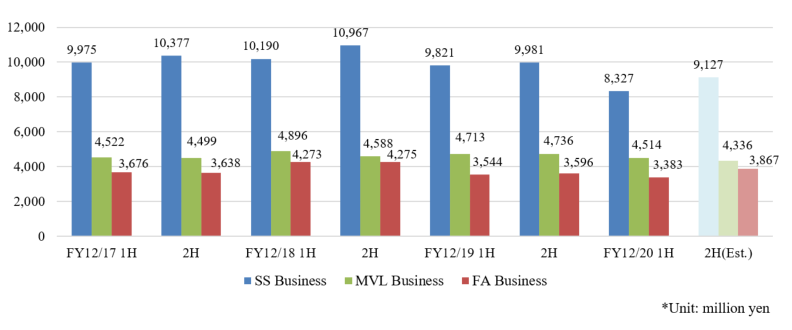
SS Business | 9,821 | 52.8% | 8,327 | 50.1% | -15.2% |
FA Business | 3,544 | 19.1% | 3,383 | 20.3% | -4.5% |
MVL Business | 4,713 | 25.3% | 4,514 | 27.1% | -4.2% |
EMS Business | 259 | 1.4% | 188 | 1.1% | -27.4% |
Others | 254 | 1.4% | 223 | 1.3% | -12.2% |
Sales | 18,593 | 100.0% | 16,636 | 100.0% | -10.5% |
SS Business | 763 | 7.8% | 331 | 4.0% | -56.6% |
FA Business | 293 | 8.3% | 288 | 8.5% | -1.7% |
MVL Business | 304 | 6.5% | 210 | 4.7% | -30.9% |
EMS Business | -32 | - | 10 | 5.3% | - |
Others | -9 | - | -32 | - | - |
Adjustments | -3 | - | -25 | - | - |
Operating profit | 1,315 | 7.1% | 783 | 4.7% | -40.5% |
*Unit: million yen. Ratio to sales of Operating profit refers to Sales Profit margin.
②Trends in each segment and region
| FY 12/19 2Q | Ratio to sales | FY 12/20 2Q | Ratio to sales | YoY |
SS: Security | 6,581 | 100.0% | 5,595 | 100.0% | -15.0% |
Japan | 1,151 | 17.5% | 1,130 | 20.2% | -1.8% |
AMERICAs | 1,310 | 19.9% | 1,121 | 20.0% | -14.4% |
EMEA | 3,437 | 52.2% | 2,726 | 48.7% | -20.7% |
Asia | 683 | 10.4% | 618 | 11.0% | -9.5% |
|
|
|
|
|
|
SS: Automatic door | 2,173 | 100.0% | 1,894 | 100.0% | -12.8% |
Japan | 1,037 | 47.7% | 991 | 52.3% | -4.4% |
AMERICAs | 609 | 28.0% | 481 | 25.4% | -21.0% |
EMEA | 466 | 21.4% | 365 | 19.3% | -21.7% |
Asia | 61 | 2.8% | 57 | 3.0% | -6.6% |
|
|
|
|
|
|
SS: Other | 1,068 | 100.0% | 838 | 100.0% | -21.5% |
Japan | 928 | 86.9% | 734 | 87.6% | -20.9% |
Asia | 140 | 13.1% | 104 | 12.4% | -25.7% |
|
|
|
|
|
|
FA | 3,544 | 100.0% | 3,383 | 100.0% | -4.5% |
Japan | 1,663 | 46.9% | 1,671 | 49.4% | +0.5% |
AMERICAs | 56 | 1.6% | 51 | 1.5% | -8.9% |
EMEA | 1,234 | 34.8% | 988 | 29.2% | -19.9% |
Asia | 591 | 16.7% | 673 | 19.9% | +13.9% |
|
|
|
|
|
|
MVL | 4,713 | 100.0% | 4,514 | 100.0% | -4.2% |
Japan | 2,952 | 62.6% | 2,883 | 63.9% | -2.3% |
AMERICAs | 418 | 8.9% | 399 | 8.8% | -4.5% |
EMEA | 770 | 16.3% | 655 | 14.5% | -14.9% |
Asia | 573 | 12.2% | 577 | 12.8% | +0.7% |
|
|
|
|
|
|
EMS Business | 260 | 100.0% | 189 | 100.0% | -27.3% |
Japan | 87 | 33.5% | 129 | 68.3% | +48.3% |
Asia/Oceania | 173 | 66.5% | 60 | 31.7% | -65.3% |
*Unit: million yen
◎SS Business
(Security-related)
Japan:Sales decreased as the sales of the outdoor security sensors for security companies and important large-scale facilities were stagnant.
AMERICAs : Marketing, sales, and installation activities were restricted due to the impact of the city lockdowns. Thus, sales of outdoor security sensors for important large-scale facilities were sluggish, and sales declined.
EMEA: Marketing, sales, and installation activities were restricted due to the impact of the city lockdowns. Hence, sales of security sensors for general residential homes in Southern Europe by the European sales subsidiary were sluggish, resulting in a significant decrease in sales.
Asia : Sales of security sensors were stagnant due to restrictions on marketing and sales activities in South Korea, resulting in a decline in sales.
(Automatic door-related)
Japan:The curtailment of opening of new shops in the retail industry affected the business, and the sales of sensors for automatic doors were sluggish and dropped.
AMERICAs : Due to the city lockdowns, marketing, sales, and installation activities for major North American customers were restricted, resulting in a significant decrease in sales.
EMEA :Due to the city lockdowns, marketing, sales, and installation activities for major European customers were restricted, resulting in a significant decrease in sales.
◎FA Business
Japan :Despite sluggish demand for capital investment in the automobile-related industry, sales increased slightly due to solid sales of image sensors for the food industry.
EMEA : Due to COVID-19 crisis, production delays and suppression of marketing activities occurred, and sales at OEM customers (SICK AG) were sluggish, and sales declined significantly.
Asia: Sales increased in China due to a rapid recovery in capital investment demand since March and steady sales of displacement sensors.
◎MVL lighting business
Japan : Although sales for 5G related investments were robust, the sales have decreased due to the restrictions on marketing activities since the second quarter.
AMERICAs : Despite ongoing projects for the smartphone industry in North America, sales have declined due to the effects of the city lockdowns since the second quarter.
EMEA : Sales decreased because of the restrictions on the French subsidiary activities due to the effects of the city lockdowns.
Asia:Despite a slowdown in semiconductor and smartphone-related investments, sales increased slightly.
(3) Financial Conditions and Cash Flow
◎Main BS
| End of Dec.2019 | End of June.2020 |
| End of Dec.2019 | End of June.2020 |
Current Assets | 30,027 | 29,505 | Current liabilities | 8,066 | 7,683 |
Cash | 12,396 | 12,797 | Payables | 1,754 | 1,746 |
Receivables | 8,700 | 7,590 | LT Interest Bearing Liabilities | 3,368 | 3,422 |
Inventories | 7,217 | 7,392 | Noncurrent liabilities | 3,528 | 3,394 |
Noncurrent Assets | 13,939 | 13,615 | ST Interest Bearing Liabilities | 433 | 398 |
Tangible Assets | 5,792 | 5,991 | Net defined benefit liabilities | 1,248 | 1,277 |
Intangible Assets | 3,829 | 3,617 | Liabilities | 11,595 | 11,078 |
Investment, Others | 4,317 | 4,007 | Net Assets | 32,372 | 32,043 |
Total assets | 43,967 | 43,121 | Total Liabilities and Net Assets | 43,967 | 43,121 |
*Unit: million yen
Total assets were 43,121 million yen, down 846 million yen from the end of the previous year, due to the decrease in receivables, etc.
Total liabilities decreased 517 million yen to 11,078 million yen.
Net assets were 32,043 million yen, down 329 million yen, due to an increase in the negative amount of foreign currency translation adjustment, etc.
Capital-to-asset ratio rose 0.7 points from the end of the previous term to 73.9%.
◎Cash Flow
| FY 12/19 2Q | FY 12/20 2Q | Increase/Decrease |
Operating cash flow | 1,718 | 1,865 | +147 |
Investing cash flow | -531 | -671 | -140 |
Free Cash Flow | 1,187 | 1,194 | +7 |
Financing cash flow | -861 | -569 | +292 |
Cash and Equivalents at the end of term | 11,682 | 12,797 | +1,115 |
*Unit: million yen
The surplus of operating cash flow expanded due to a decrease in trade receivables. Free cash flow was almost unchanged.
The cash position improved.
(4) Topics
◎OPTEX Co., Ltd. was selected as one of the “New 100 Global Niche Top (GNT) Companies (Electrical/Electronics Division)”
In June 2020, OPTEX Co., Ltd. was selected by the Ministry of Economy, Trade and Industry as one of the “New 100 Global Niche Top (GNT) Companies (Electrical/Electronics Division).” The company was selected as it is a company that develops highly unique products and services that have top market share in the global market.”
This is the second time the company received this award as it received it before in 2013.
The “New 100 Global Niche Top (GNT) Companies” of the Ministry of Economy, Trade and Industry recognizes companies that have established a unique position in a niche field among companies that are working to develop the international market. Among the four qualitative and quantitative evaluation items of “profitability,” “strategy,” “competitive advantage,” and “internationality,” the selection focuses on (1) balancing global market share and profit, (2) uniqueness and independence of technology, and (3) importance in the supply chain.
OPTEX’s automatic door, which was selected for recognition, was the world’s first automatic door sensor using far-infrared rays, and currently has a market share of 30% in the world (50% in Japan). It is used in many commercial facilities, office buildings, hospitals, etc.
◎ Abolishing the shareholder benefit system
The company decided to abolish the system with shareholder benefits granted to shareholders listed or recorded as of the end of December 2019.
As a result of careful consideration of the recent business environment, OPTEX decided to prioritize profit distribution through dividends.
The company regards the return of profits to shareholders as one of the most critical management issues, and plans to pay stable and continuous dividends.
3. Fiscal Year Ending December 2020 Earnings Forecasts
(1) Earnings forecast
| FY 12/19 | Ratio to sales | FY 12/20 Est. | Ratio to sales | YoY | Percentage of progress |
Sales | 37,517 | 100.0% | 34,500 | 100.0% | -8.0% | 48.2% |
Operating profit | 2,856 | 7.6% | 1,800 | 5.2% | -37.0% | 43.5% |
Ordinary profit | 2,876 | 7.7% | 2,000 | 5.8% | -30.5% | 43.6% |
Net profit | 2,197 | 5.9% | 1,200 | 3.5% | -45.4% | 48.8% |
*Unit: million yen.
Sales and profit declined
On July 13, OPTEX announced the full-year forecast for the fiscal year ending December 2020, which was once left undecided. Sales are expected to drop 8.0% year on year to 34.5 billion yen, and operating profit is estimated to decline 37.0% to 1.8 billion yen. The sales loss of SS business will improve compared with the first half. The FA business is expected to recover, mainly in Europe and China, and to increase sales. On an ordinary dividend basis, the dividend is to be 30.00 yen/share, unchanged from the previous year. The expected payout ratio is 90.4%.
◎Regional trends
| FY 12/19 | Ratio to sales | FY 12/20 Est. | Ratio to sales | YoY | Percentage of progress |
Consolidated sales | 37,517 | 100.0% | 34,500 | 100.0% | -8.0% | 48.2% |
Domestic | 16,971 | 45.2% | 16,000 | 46.4% | -5.7% | 48.5% |
International | 20,546 | 54.8% | 18,500 | 53.6% | -10.0% | 48.0% |
AMERICAs | 4,766 | 12.7% | 4,420 | 12.8% | -7.3% | 46.4% |
Europe | 11,333 | 30.2% | 9,696 | 28.1% | -14.4% | 48.8% |
Asia | 4,447 | 11.9% | 4,384 | 12.7% | -1.4% | 47.7% |
◎Average exchange rate
| FY 12/19 | FY 12/20 Est. |
USD | ¥109.05 | ¥106.64 |
EURO | ¥122.07 | ¥117.15 |
(2) Trends in each segment
①Sales of each segment
| FY 12/19 | Ratio to sales | FY 12/20 Est. | Ratio to sales | YoY | Percentage of progress |
SS Business | 19,802 | 52.8% | 17,454 | 50.6% | -11.9% | 47.7% |
FA Business | 7,140 | 19.0% | 7,250 | 21.0% | +1.5% | 46.7% |
MVL Business | 9,449 | 25.2% | 8,850 | 25.7% | -6.3% | 51.0% |
EMS Business | 570 | 1.5% | 419 | 1.2% | -26.5% | 45.1% |
Others | 553 | 1.5% | 527 | 1.5% | -4.7% | 42.3% |
Consolidated sales | 37,517 | 100.0% | 34,500 | 100.0% | -8.0% | 48.2% |
*Unit: million yen.
②Trends in each segment and region
| FY 12/19 | Ratio to sales | FY 12/20 Est. | Ratio to sales | YoY | Percentage of progress |
SS: Security | 13,254 | 100.0% | 11,494 | 100.0% | -13.3% | 48.7% |
Japan | 2,495 | 18.8% | 2,506 | 21.8% | +0.4% | 45.1% |
AMERICAs | 2,648 | 20.0% | 2,459 | 21.4% | -7.1% | 45.6% |
EMEA | 6,768 | 51.1% | 5,267 | 45.8% | -22.2% | 51.8% |
Asia | 1,343 | 10.1% | 1,262 | 11.0% | -6.0% | 49.0% |
|
|
|
|
|
|
|
SS:Automatic door | 4,439 | 100.0% | 3,990 | 100.0% | -10.1% | 47.5% |
Japan | 2,267 | 51.1% | 2,123 | 53.2% | -6.4% | 46.7% |
AMERICAs | 1,159 | 26.1% | 1,021 | 25.6% | -11.9% | 47.1% |
EMEA | 878 | 19.8% | 710 | 17.8% | -19.1% | 51.4% |
Asia | 135 | 3.0% | 136 | 3.4% | +0.7% | 41.9% |
|
|
|
|
|
|
|
SS: Others | 2,110 | 100.0% | 1,970 | 100.0% | -6.6% | 42.5% |
Japan | 1,840 | 87.2% | 1,688 | 85.7% | -8.3% | 43.5% |
AMERICAs | 2 | 0.1% | 1 | 0.1% | -50.0% | - |
Asia | 268 | 12.7% | 281 | 14.3% | +4.9% | 37.0% |
|
|
|
|
|
|
|
FA | 7,140 | 100.0% | 7,250 | 100.0% | +1.5% | 46.7% |
Japan | 3,616 | 50.6% | 3,448 | 47.6% | -4.6% | 48.5% |
AMERICAs | 113 | 1.6% | 134 | 1.8% | +18.6% | 38.1% |
EMEA | 2,158 | 30.2% | 2,319 | 32.0% | +7.5% | 42.6% |
Asia | 1,253 | 17.5% | 1,349 | 18.6% | +7.7% | 49.9% |
|
|
|
|
|
|
|
MVL | 9,449 | 100.0% | 8,850 | 100.0% | -6.3% | 51.0% |
Japan | 5,947 | 62.9% | 5,491 | 62.0% | -7.7% | 52.5% |
AMERICAs | 844 | 8.9% | 805 | 9.1% | -4.6% | 49.6% |
EMEA | 1,529 | 16.2% | 1,400 | 15.8% | -8.4% | 46.8% |
Asia | 1,129 | 11.9% | 1,154 | 13.0% | +2.2% | 50.0% |
|
|
|
|
|
|
|
EMS Business | 571 | 100.0% | 419 | 100.0% | -26.6% | 45.1% |
Japan | 252 | 44.1% | 217 | 51.8% | -13.9% | 59.4% |
Asia and Oceania | 319 | 55.9% | 202 | 48.2% | -36.7% | 29.7% |
*Unit: million yen.
4. Growth Strategy
In order to achieve further growth, the company believes that it is necessary to take on the challenge of transforming the business model from “selling goods” to “selling services” (= providing solutions) in each segment.
SS Business(Crime prevention)
 | FA Business
 | MVL Business
 |
(Taken from the reference material of the company)
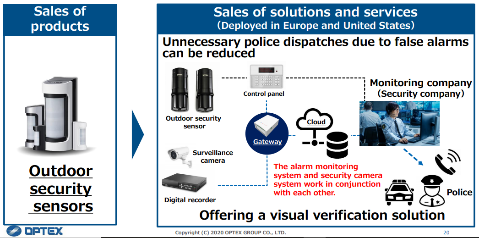
(1) SS business (crime prevention)
【“Visual verification solutions” for the spread of prevention of crimes in outdoors】
◎Scale, current situation, and problems of the market of alarm monitoring
The number of contracts for alarm monitoring with outdoor sensors is over 90 million around the world. It is 40 million in North America and 20 million in EMEA (including 3 million in the U.K.). North America and the U.K. account for nearly half of them.
However, alarm monitoring has been adopted in many places outside Japan, 95% of security alarms are reportedly false. In most cases, users fail to operate the device, but in some cases that is malfunction of outdoor sensors.
(Taken from the reference material of the company)
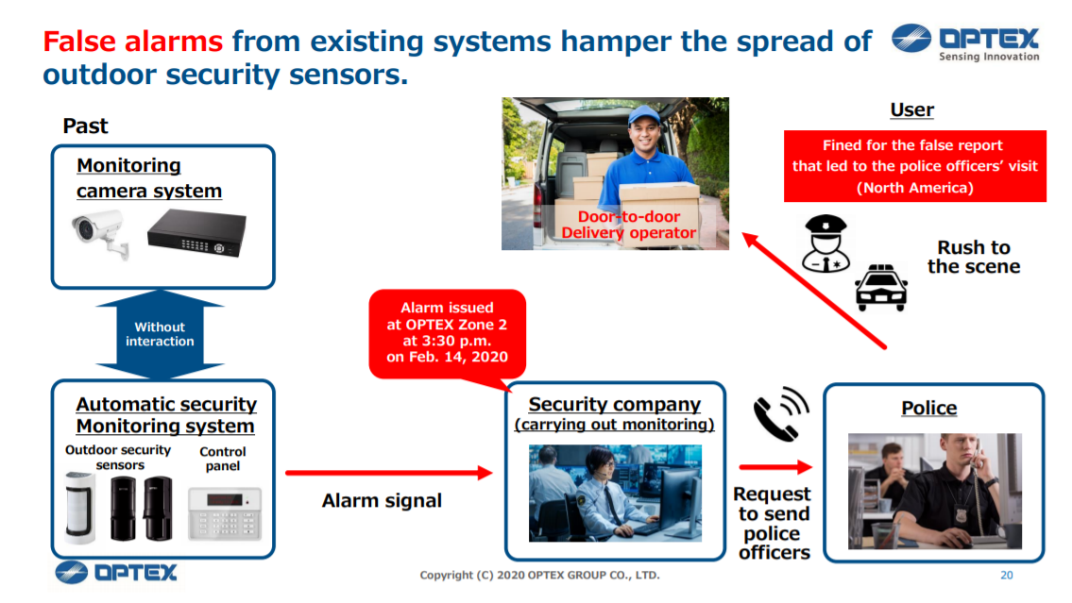
In the current alarm monitoring system, alarm signals from sensors and videos from surveillance cameras are transmitted to a monitoring company without linkage, as shown in the figure below.
Accordingly, the monitoring company calls a user or the police without verifying the videos of the scene after receiving alarm signals. It leads to false alarms.
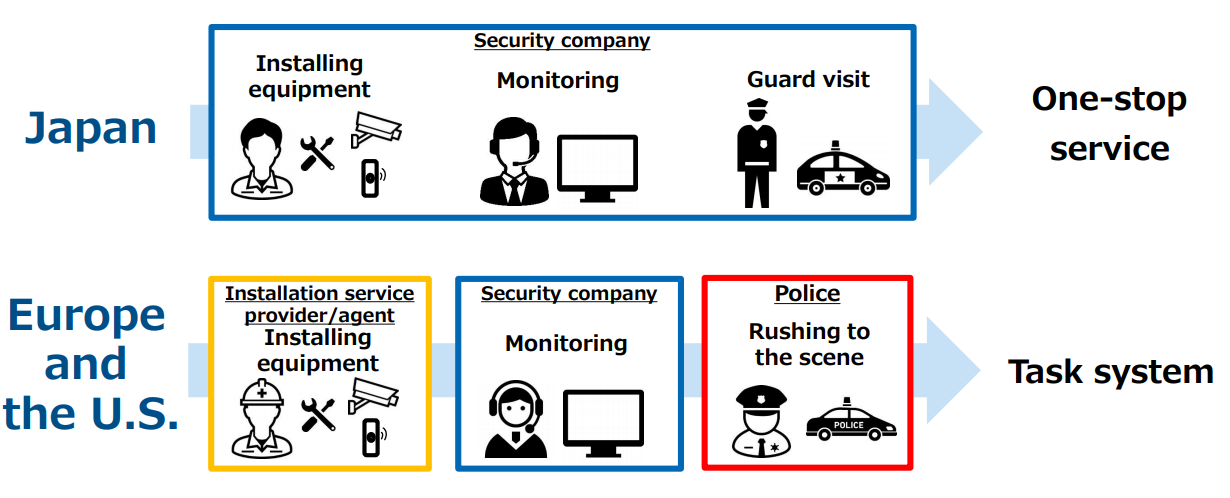
Also, in Japan, security companies are responsible for installation, monitoring, and rush to the scene, while in Europe and the United States, the police receive calls from monitoring companies. If the police move due to a false alarm, the user has to pay a fine. Like this, there are various problems with actual operation.
(Taken from the reference material of the company)
◎Outline of the Visual Verification Solution
OPTEX GROUP Co., Ltd., which is highly evaluated and trusted for its outdoor sensors around the world, decided to develop a new alarm monitoring system, while considering that solving the false alarm problem would lead to the distribution of outdoor alarm monitoring and the expansion of the market
①System
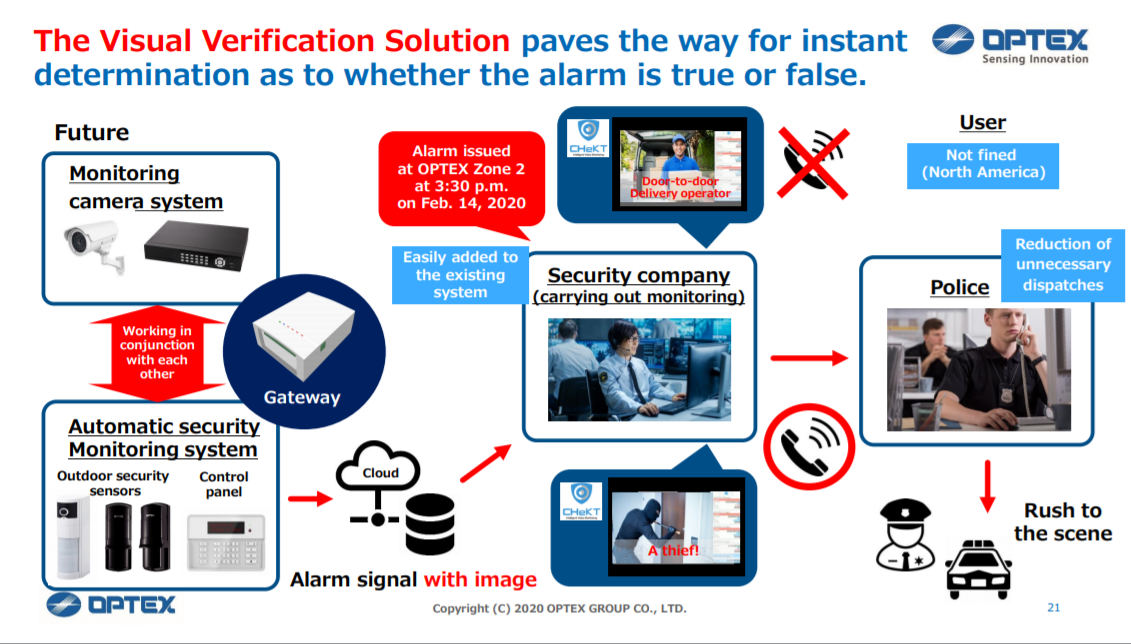
In the new system, a gateway is installed for linking an alarm monitoring system and a monitoring camera system.
By adding a gateway and operation software to the existing system, a monitoring company can always receive camera videos linked to alarm signals, so it is possible to reduce false alarms significantly.
(Taken from the reference material of the company)
This system was embodied by utilizing a gateway that incorporates the Visual verification solutions of CHeKT (in the U.S.), with which the company formed a strategic alliance.
CHeKT is a venture firm established in 2014, and its CEO is the owner and CEO of a security company, so he is versed in the security industry.
Therefore, it is possible to offer solutions suited for on-site needs, which were developed based on the experience at the security company. In addition, there are a lot of advantages. Advanced IT skills are not required, a system that can be connected to the network camera with standard specs has been established, and charge-free, easy-to-use operation software is provided.
②Business model
OPTEX GROUP Co., Ltd. has the exclusive right to sell this system in North America and the U.K., and offer the system to high-end customers such as commercial facilities, offices, and high-end residences. The company doesn’t only sell products, including the gateway, security sensor, but also carries out the subscription-type charging business providing the system.
This system can be installed at low cost and rarely causes false alarms, so it is considered beneficial to all stakeholders, including users, monitoring companies, and the police. The company aims to diffuse a win-win business model.
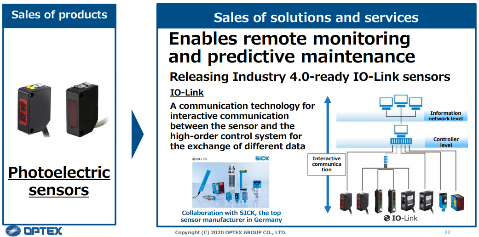
(2) FA business
【Compatibility with Industry 4.0】
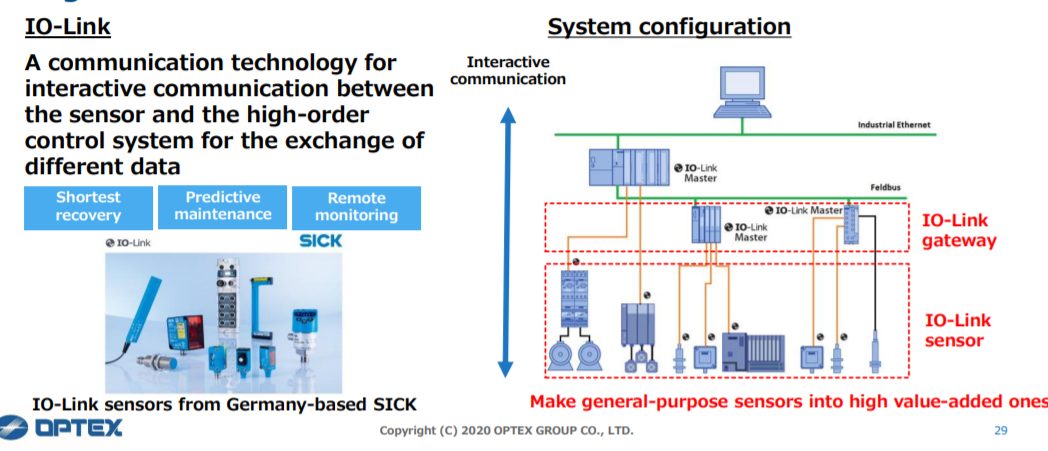
Through the unified management of sensors, the company will release “IO-Link Sensor” and “IO-Link Gateway,” which are compatible with Industry 4.0.
With IO-Link, which is a communications technology for exchanging various data interactively between sensors and a superior control system, it is possible to grasp the status of each device remotely, estimate durability, and recover devices as soon as possible at the time of breakdown.
The company promotes distribution in cooperation with SICK AG, which is the No.1 sensor manufacturer in Germany and transforms from selling photoelectric sensors as a product to a service.
(Taken from the reference material of the company)
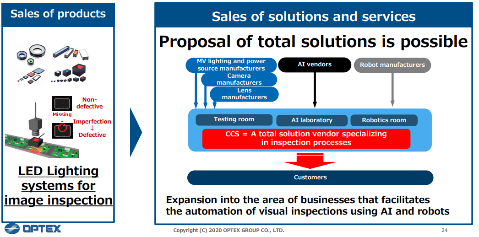
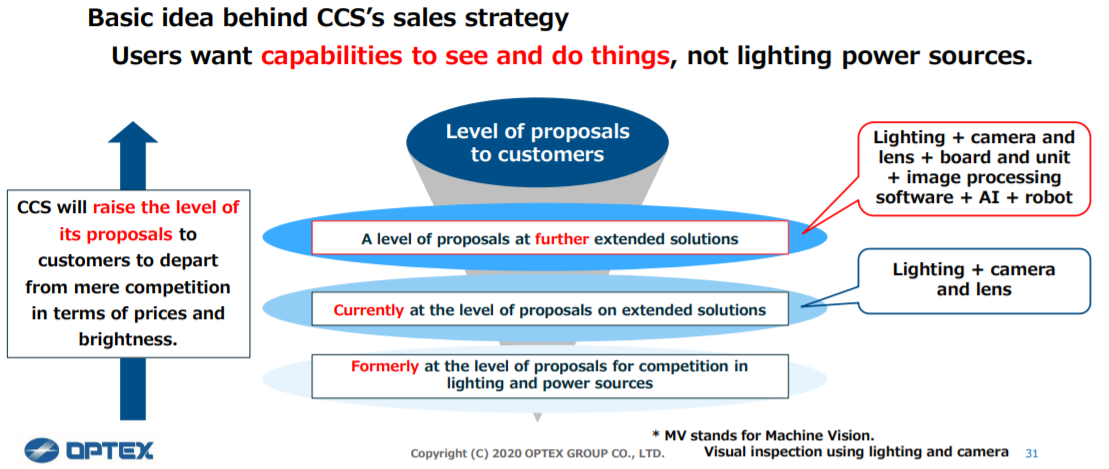
(3) MVL business
【From “a manufacturer of LED lightings for imaging tests” to “a comprehensive solution vendor”】
CCS Inc., which deals with this business, offers LED lightings, power sources, and solutions with cameras and lenses, and aims to develop extended solutions combining boards, image processing software, AI, and robots, and go ahead with stages of giving proposals, under the basic concept that users demand “Visible!” and “Possible!” rather than power sources for lighting.
They consider speed is important in order not to fall into price competitions.
In addition, the company aims to cultivate the visual check market, whose scale is said to be 250 billion yen, by utilizing AI and robots.
(Taken from the reference material of the company)
5. Conclusions
COVID-19 significantly affected the performance in the first half of the current year. The company expects a recovery in the second half, despite a decline in sales and profits for the full year. Among the company’s segments, the FA business is expected to exceed the previous year’s earnings due to the recovery in Europe in the second half in addition to China in the first half. Also, the expansion of “non-contact demand” during the pandemic in the SS business (automatic doors) may become a long-term theme. On the other hand, it seems that it will take a little longer for the recovery of the outdoor security sensors in Europe, which have been driving growth so far. This will determine whether OPTEX can get into a full-scale recovery path. We would also like to pay attention to the progress of the “Visual Verification Solution,” which would be the core of the business model reform.
<Reference: Regarding Corporate Governance>
◎Organization type, and the composition of directors and auditors
Organization type | Company with audit and supervisory committee |
Directors | 11directors, including 4 outside ones |
◎Corporate Governance Report
The latest revision date: March 27, 2020
<Fundamental concept>
As the Group, we recognize that it is our greatest mission to continuously improve corporate value while earning the trust of our shareholders, investors, customers and society. To practice it, we consider enhancement of the corporate governance as one of important management tasks and aim to improve the transparency of management, maintain management systems accompanying fair and prompt decision making and strengthen management monitoring function.
<Reasons for Non-compliance with the Principles of the Corporate Governance Code (Excerpts)>
The company has implemented all of the principles of the Governance Code.
<Disclosure Based on the Principles of the Corporate Governance Code (Excerpts)>
Principle | Items to be disclosed |
Principle 1-4 Cross-Shareholdings | Only if the Company deems it to be strategically conducive to the enhancement of business relationships and increased corporate value for the Group will it acquire shares for cross-shareholding upon discussions and resolutions of the Board of Directors. In addition, the Company examines the significance of cross-shareholdings at a meeting of the Board of Directors every year. If the Company determines it to be rationally pointless to hold certain shares in light of the intended objectives of cross-shareholding, it will sell them in consideration of market trends, etc., thereby endeavoring to reduce such holdings. Listed shares currently held by the Company: One stock amounting to 48 million yen (amount recorded on the balance sheet) With regard to exercising the voting rights it holds, the Company approves or disapproves shareholder proposals based on comprehensive judgment by examining each agenda item individually according to its criteria for exercising voting rights and by taking into consideration whether or not the proposed motion will contribute to the sustained growth of the subject company and the enhancement of corporate value thereof and whether or not the proposed motion will cause significant damage to shareholder value. |
Principle 5-1 Policy for the constructive dialogues with shareholders | To facilitate proactive and constructive dialogue with shareholders, the Company has established an IR section and endeavors to provide clear explanations of the Company’s management policy and management situation. In addition, IR personnel and officers systematically hold briefings for institutional investors and briefings for individual investors and field requests for interviews from institutional investors. Moreover, the ordinary general meetings of shareholders are held on Saturdays to ensure the attendance of a wide range of shareholders, and these meetings are followed by briefings for shareholders and social gatherings for shareholders to ensure that they understand the Company’s policies for the future. Note: At the 41st Ordinary General Meeting of Shareholders, the Company cancelled the social gathering for shareholders to prevent the spread of COVID-19. |
This report is intended solely for information purposes, and is not intended as a solicitation to invest in the shares of this company. The information and opinions contained within this report are based on data made publicly available by the Company, and comes from sources that we judge to be reliable. However, we cannot guarantee the accuracy or completeness of the data. This report is not a guarantee of the accuracy, completeness or validity of said information and or opinions, nor do we bear any responsibility for the same. All rights pertaining to this report belong to Investment Bridge Co., Ltd., which may change the contents thereof at any time without prior notice. All investment decisions are the responsibility of the individual and should be made only after proper consideration. Copyright(C) 2020, All Rights Reserved by Investment Bridge Co., Ltd. All rights Reserved. |