Bridge Report:(6914)OPTEX GROUPSecond quarter of fiscal year ending December 2021
![]()
 Isamu Oguni President and CEO | OPTEX GROUP (6914) |
 |
Company Information
Market | TSE 1st Section |
Industry | Electric equipment (manufacturer) |
President and CEO | Isamu Oguni |
HQ Address | 4-7-5, Nionohama, Otsu, Shiga Prefecture |
Year-end | December |
Homepage |
Stock Information
Share Price | Shares Outstanding (Term end) | Total market cap | ROE Act. | Trading Unit | |
¥1,447 | 37,735,784 shares | ¥54,603 million | 4.3% | 100 shares | |
DPS Est. | Dividend yield Est. | EPS Est. | PER Est. | BPS Act. | PBR Act. |
¥30.00 | 2.1% | ¥92.64 | 15.6x | ¥896.02 | 1.6x |
*The share price is the closing price on August 18. Shares outstanding, DPS and EPS are taken from the brief financial report for the second quarter of FY December 2021. ROE and BPS are the results in the previous term.
Earnings Trend
Fiscal Year | Sales | Operating profit | Ordinary profit | Net profit | EPS | DPS |
December 2017 | 37,504 | 4,885 | 5,036 | 3,386 | 97.63 | 27.50 |
December 2018 | 40,113 | 4,989 | 5,038 | 3,775 | 104.85 | 30.00 |
December 2019 | 37,517 | 2,856 | 2,876 | 2,197 | 60.02 | 32.50 |
December 2020 | 34,846 | 2,098 | 2,176 | 1,395 | 38.59 | 30.00 |
December 2021 Est. | 45,000 | 4,500 | 4,800 | 3,350 | 92.64 | 30.00 |
* Net profit is net profit attributed to parent shareholders. On April 1, 2018, a 2-for-1 stock split was implemented. Both EPS and DPS are revised retroactively.
This Bridge Report presents OPTEX GROUP’s earnings results for the second quarter of fiscal year ending December 2021 and so on.
Table of Contents
Key Points
1. Company Overview
2. The Second Quarter of Fiscal Year Ending December 2021 Earnings Results
3. Fiscal Year Ending December 2021 Earnings Forecasts
4. Medium Term Business Plan
5. Conclusions
<Reference: Regarding Corporate Governance>
Key Points
- In the second quarter of the fiscal year ending December 2021, sales grew 36.7% year on year to 22,750 million yen. The acquisition of Sanritz Automation Co., Ltd. as a subsidiary in the previous term as well as strong growth of the existing businesses such as the the FA segment, IA business, contributed to the sales increase. Operating profit was 2,520 million yen, up 221.8% year on year. Although the acquisition of Sanritz Automation as a subsidiary reduced gross profit margin, the rise in sales increased gross profit. The company achieved significant profit growth by offsetting an increase in SG&A. The initial forecasts announced in February were exceeded considerably. Both sales and profit grew greatly year on year also on a quarterly basis. Sales in the second quarter hit a record high.
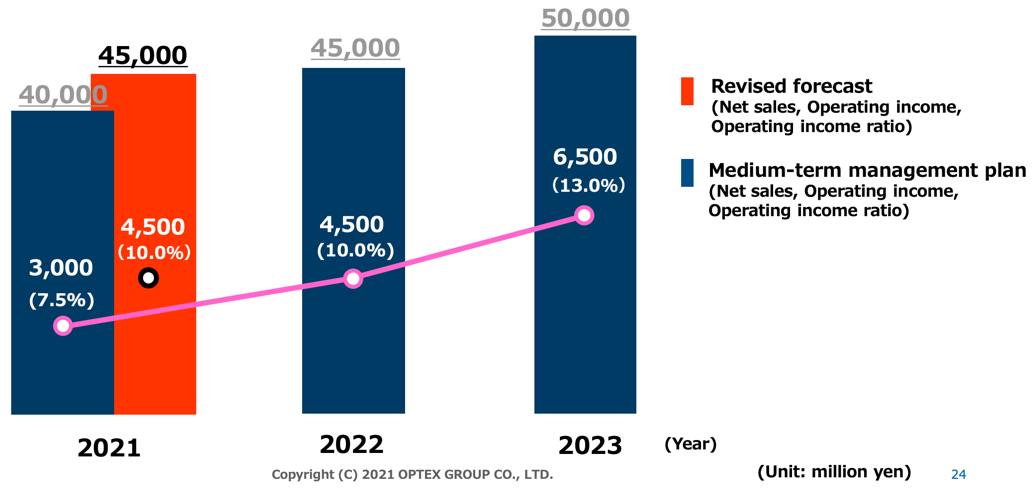
- The company revised its full-year business forecasts based on the powerful performance in the first half. Sales and operating profit are projected to grow by 29.1% and 114.4% year on year to 45 billion yen and 4.5 billion yen, respectively. Sales is expected to rise by double digits in all the regions and all the company’s major business segments. Sanritz Automation, which was acquired as a subsidiary, is expected to make a sales contribution of about 3.5 billion yen. In the third and subsequent quarters, the assumed currency exchange rate remains 105 yen for a dollar. The exchange rate for a euro has been changed from 120 yen to 125 yen. There is no change in the dividend estimate. The company plans to pay a dividend of 30.00 yen per share, unchanged from the previous term. The estimated payout ratio is 32.4%.
- Under its business philosophy, “We aim to become a corporate group full of Venture Spirit!” OPTEX GROUP is taking on another challenge to generate sales of 50 billion yen in the fiscal year ending December 2023. It revised the full-year business forecasts for the fiscal year ending December 2021 upward, delivering stronger business performance than the initial forecast. The company strives to achieve sales of 50 billion yen, a goal set for the final fiscal year of the business plan, ahead of schedule.
- It is necessary to further strengthen group management for attaining the goals of the medium-term business plan, and the company considers business growth, strengthening of the manufacturing system, and enhancement of the management structure as three pillars of its business strategies. For business growth, it will pursue expansion of sales and profit through a three-tiered business structure that is based on (i) further growth of the existing businesses (Sensing Solution (SS) and Industrial Automation (IA) Businesses), (ii) growth through transformation of the business model from “Mono Uri (selling products)” to “Koto Uri (selling solutions and services),” and (iii) acceleration of growth through such means as M&As.
- In the current term that is the first step in taking on another challenge to generate sales of 50 billion yen, the company made an extensive upward revision to the full-year business forecast as the business results in the first half exceeded the initial forecast for the businesses related mainly to factory automation. In the second half, however, sales and profit are expected to shrink when compared with those of the first half although they both will increase by 22% and 51%, respectively, when compared with the sales and profit of the same period of the year before. The company gives a conservative forecast because it anticipates that components will be in short supply.
- Although factors behind uncertainty amid the novel coronavirus pandemic are still at play, a growing number of people have received vaccination against the disease across the world, which has improved the situation from the profound insecurities in the previous year. Under these circumstances, we would like to keep an eye on whether OPTEX GROUP will be able to solidify its business foundation for boosting sales in the third and ensuing quarters and achieving the objective of the medium-term business plan, which is sales of 50 billion yen in the final fiscal year (ending December 2023), ahead of schedule.
1. Company Overview
OPTEX GROUP Co., Ltd. is a holding company centered around OPTEX Co., Ltd. that manufactures and sells outdoor sensors (top share of 40% in the global market), automatic door sensors (30% share of the global market and 50% share of the domestic market) and environment-related products.
OPTEX GROUP holds subsidiaries including OPTEX FA CO., LTD., which deals with FA related sensing business; CCS Inc., which holds the global top share in the LED lighting business for image processing; Sanritz Automation Co., Ltd., which has a wealth of results in the development, manufacturing and sales of industrial computers, Three Ace Co., Ltd., which specializes in the development of various systems, applications, and digital content; Optex MFG Co., Ltd., which is responsible for manufacturing Group products, RAYTEC LIMITED (UK), which has attained the largest global share (about 50 %) for supplemental lights for CCTV; and FIBER SENSYS INC. (US), which deals with optical fiber intrusion detection systems.
As of December 31, 2020, the company operates in 84 locations worldwide, including 28 overseas companies.
OPTEX CO., LTD. | Develops and sells sensors for various uses, such as security sensors and sensors for automatic doors |
OPTEX FA CO., LTD. | Development and sales of photoelectric sensors, image inspection systems, displacement sensors and measuring instruments |
CCS Inc. | Development, manufacturing and sales of LED lighting devices, and systems for image processing |
Sanritz Automation Co., Ltd. | Development, manufacturing and sales of industrial computers |
THREE ACE CO., LTD. | Development of various systems, applications, and digital content |
OPTEX MFG CO., LTD. | Manufactures products for the Group and provides contract manufacturing service for electronic equipment |
SICK OPTEX CO., LTD. | Development of general-purpose photoelectric sensors. A joint venture of SICK AG (Germany) and OPTEX FA CO., LTD. |
GIKEN TRASTEM CO., LTD. | Development, manufacturing and sales of people counting systems, customer traffic counting/management systems |
ZENIC INC. | Contracted development of IC and LSI for image processing, and design and sales of FA systems |
O’PAL OPTEX CO., LTD. | Management of outdoor activities and environmental hands-on learning programs |
FIBER SENSYS INC. (US) | Development, manufacturing and sales of fiber-optic intrusion detection systems |
FARSIGHT SECURITY SERVICES LTD. (UK) | Security company providing remote video surveillance services |
RAYTEC LIMITED. (UK) | Development, manufacturing and sales of supplemental lighting for surveillance cameras |
GARDASOFT VISION LIMITED. (UK) | Development, manufacturing, and sale of LED lighting controllers for machine vision |
1-1 Corporate History
In May 1979, Mr. Toru Kobayashi (currently serving as a director and senior corporate adviser), who was developing security sensors in a manufacturer of anti-crime devices in Kyoto, established OPTEX Co., Ltd. with the spirit of the endeavor to “make their products recognized in the world as much as possible.”
In November 1979, the company developed “the world’s first far-infrared sensor for automatic doors.” Around that time, pressure-sensitive rubber mats were used for automatic doors, and an automatic door sensor that utilizes far-infrared light was epoch-making. OPTEX was unrivaled in maintenance and installation services and seized the largest share in the market of automatic door sensors in the third year after inauguration (currently occupying about 50% of the Japanese market).
Since then, the company has developed a wide array of products for security, automatic doors, and industrial equipment with its unique ideas and technologies that embodies them.
In the 1980s, the company entered overseas markets. While it had been considered impossible to set a far-infrared sensor outdoors because external factors, such as light, would cause errors, the company developed the outdoor far-infrared sensor “VX-40” with its original technology, and that sensor was highly evaluated mainly in the European market, and occupied the largest share in the global market of outdoor intrusion detection sensors.
Through business expansion, the company became an over-the-counter company (equivalent to being listed in the JASDAQ market) in 1991. Then, it was listed in the second section of Tokyo Stock Exchange (TSE) in 2001, and in the first section of TSE in 2003.
Recently, the company has been strengthening solutions based on image processing technologies and high-end security systems. In 2008, it reorganized ZENIC INC., which undertakes the development of ICs and LSI for image processing, etc., into a subsidiary. In 2010, it acquired FIBER SENSYS INC. (US), which has plenty of experience handling high-end security systems (optical fiber intrusion detection systems) for important facilities in Europe and the U.S., as a subsidiary. In 2012, it acquired RAYTEC LIMITED (UK), which handles supplemental lighting for cameras of high-end security systems for important large-scale facilities, as a subsidiary.
In May 2016, it acquired CCS Inc., which has the world’s largest share in the market of LED lighting for image processing, as a subsidiary, and transformed it into a 100% subsidiary in July 2018.
With the aim of adopting next-generation business administration and pursuing group synergy, it shifted to the holding company system on January 1, 2017.
Mr. Isamu Oguni was appointed as President and CEO in March 2019.
In December 2020, the company acquired Sanritz Automation Co., Ltd., which has an abundance of experience in developing, manufacturing, and selling industrial computer systems, as a subsidiary. In February 2021, it announced a three-year medium-term management plan ending fiscal 2023. To achieve this plan, the company aims for further growth as the global niche No. 1 company by promoting business model reforms and strengthening solution proposal capabilities.
1-2 Business Description
The Company’s business is composed of its main SS business (security sensor segment and automatic door sensor segment), sensors for industrial machinery, LED lighting device and system for image processing, the “IA Business” which works towards the automation, labor saving, and optimization of the production line using industrial computers, “EMS business,” which was included in the SS business up until the previous term and provides contract manufacturing services for electronic equipment in China, and Other business (operation of sport clubs and development of applications and digital content).
The above segmentation will be put into practice from the first quarter of the fiscal year ending December 2021.
Segment | Business Description | |
SS Business | Security Sensor segment | Main products include various indoor and outdoor sensors, wireless security systems and LED lighting control systems, etc. For outdoor sensors, the company has the leading share in the global market. Recently, it focuses on development of the automobile detection sensor using microwave technologies. |
Automatic Door Sensor segment | The company developed the world’s first automatic door sensor using infrared rays. Main products are automatic door opening/closing sensors, shutter sensors for factories, wireless touch switches, etc. | |
Other | Equipment for measuring water quality. Transportation safety products, Customer traffic counting/management systems, developing/marketing of image processing-related products. | |
IA Business | FA segment | Main products include photoelectric sensors used for quality control and automation of production lines, displacement sensors, image sensors, LED lights, etc. In Japan, these products are provided to a wide range of industries such as food or pharmaceutical for quality control of production lines. In Europe, its products on an OEM basis through its technological partner SICK AG (Germany) that has the largest share in industrial sensor market. Also, its house-brand products have been launched in Asia and North America. |
MVL segment | The company has a significant share in the LED lighting business for image processing. The company offers solutions using the natural light LED developed by the company, which boasts the best color rendering property in the field. | |
IPC segment | Has shown great results in the development, manufacturing, and sale of industrial computers. Specializes in the development of devices and systems that require both “hardware” and “software” of industrial built-in computers. | |
EMS-related | Contract manufacturing services for electronic equipment, developed at a factory in China. | |
Others | Operating outdoor activities and environmental hands-on learning programs and development of applications and digital content. | |
*SS: Sensing Solution、IA:Industrial Automation、FA:Factory Automation、MVL:Machine Vision Lighting、IPC:Industrial PC 、EMS: Electronics Manufacturing Service
1-3 Advantages: Diversified Technologies/Expertise on Sensing and Unique Sensing Algorithm
To produce stable and reliable sensors, it is essential to build on a number of elemental technologies and expertise, as well as “algorithms” to control physical changes. The company takes advantage of its technologies/expertise suitable for intended applications and its unique sensing algorithm to secure the largest share in the global market.
Noise abatement technology | ・Hardware design to minimize various noises ・Conduct a number of environmental assessments based on its own standard, and launch products that passed the assessments |
Sophisticated optical design | ・Make use of optical simulation to achieve high-density areas eliminating blind spots ・Packaging technologies to enable downsizing |
Compliant to public standards for reliability | ・Adapted and compliant to any global standards ・Adapted and compliant to industry standards and guidelines (CE marking, EN standard [TUV certified], ANSI, JIS, etc.) |
Environment friendly design | ・By identifying 15 restricted-use materials and 10 self-control materials, the company succeeded in excluding toxic substances in all products ・Compliant to RoHS directive, lead-free solder alloy ・Design to minimize the effect from CO2 when in use |
Secure & safe control | ・Adopt self-diagnosis functions in emergency or in failure to prevent system outage, and fail-safe devices for sensors ・Propose preventive maintenance measures to maintain functions |
Unique sensing algorithm | ・Unique algorithm to eliminate the impact of noise ineliminable by hardware, detect, scan and analyze only the intended events ・Various automatic correction functions to maintain performance in the field |
1-4 ROE analysis
| FY 12/ 11 | FY 12/ 12 | FY 12/ 13 | FY 12/ 14 | FY 12/ 15 | FY 12/ 16 | FY 12/ 17 | FY 12/ 18 | FY 12/ 19 | FY 12/ 20 |
ROE (%) | 6.0 | 4.6 | 8.2 | 8.6 | 8.7 | 7.4 | 12.6 | 12.3 | 6.8 | 4.3 |
Net profit margin (%) | 5.58 | 3.99 | 6.87 | 7.39 | 7.38 | 5.83 | 9.03 | 9.41 | 5.86 | 4.00 |
Total asset turnover (times) | 0.85 | 0.91 | 0.92 | 0.89 | 0.91 | 0.91 | 0.95 | 0.95 | 0.86 | 0.76 |
Leverage (times) | 1.27 | 1.28 | 1.30 | 1.31 | 1.30 | 1.41 | 1.48 | 1.38 | 1.35 | 1.41 |
The company is aiming for an early recovery to the target of 10% or more.
1-5 Efforts on ESG
The company believes that building a relationship of trust with a wide range of stakeholders is essential for improving corporate value and has posted 「ESG information」(https://www.optexgroup.co.jp/en/esg/stakeholder.html)on its website to further enhance ESG information disclosure. In addition, Published the ESG Bridge Report through Investment Bridge Inc.
The company identify the materiality for sustainable growth for the first time, and mention the challenges and initiatives for the future in the report.
https://www.bridge-salon.jp/report_bridge/archives/eng/6914/20210525.html
2. The Second Quarter of Fiscal Year Ending December 2021 Earnings Results
(1) Business Results
| 2Q of FY 12/20 | Ratio to sales | 2Q of FY 12/21 | Ratio to sales | YoY | Difference from previous forecast |
Sales | 16,636 | 100.0% | 22,750 | 100.0% | +36.7% | +19.7% |
Gross profit | 8,974 | 53.9% | 11,862 | 52.1% | +32.2% | - |
SG&A | 8,190 | 49.2% | 9,341 | 41.1% | +14.1% | - |
Operating profit | 783 | 4.7% | 2,520 | 11.1% | +221.8% | +152.0% |
Ordinary profit | 872 | 5.2% | 2,841 | 12.5% | +225.6% | +147.0% |
Quarterly Net Profit | 586 | 3.5% | 1,921 | 8.4% | +227.7% | +174.4% |
*Unit: million yen. The Quarterly Net profit is the quarterly profit attributable to owners of the parent company. The same shall apply hereinafter. The difference from previous forecast is based on a comparison to the forecasts announced in February of 2021.
Substantial increase in sales and profit, the initial forecasts were exceeded considerably
Sales grew 36.7% year on year to 22,750 million yen. The acquisition of Sanritz Automation Co., Ltd. as a subsidiary in the previous term as well as strong growth of the existing businesses such as the FA segment, IA business, contributed to the sales increase. Operating profit was 2,520 million yen, up 221.8% year on year. Although the acquisition of Sanritz Automation as a subsidiary reduced gross profit margin, the rise in sales increased gross profit. The company achieved significant profit growth by offsetting an increase in SG&A. The initial forecasts announced in February were exceeded considerably.
◎Trends in each quarter
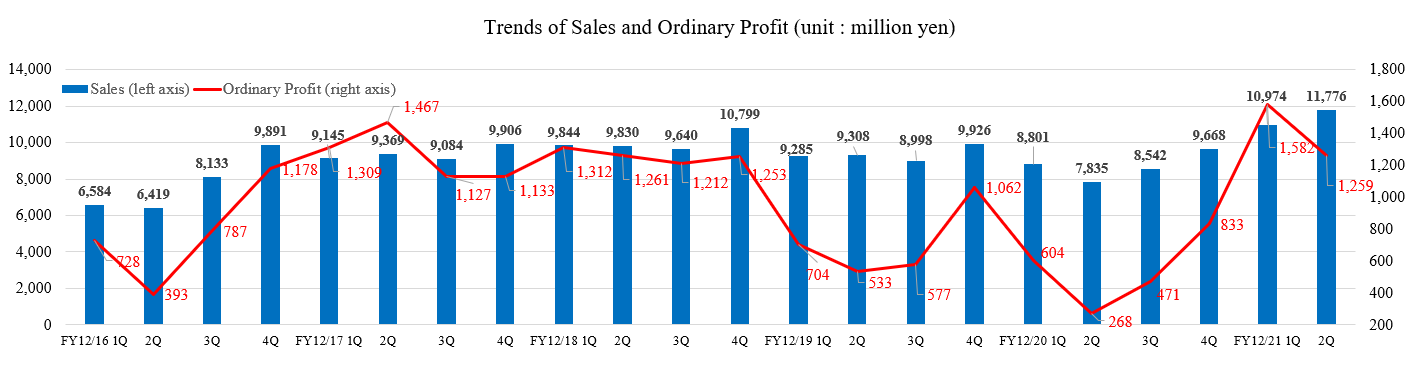
Both sales and profit grew greatly year on year also on a quarterly basis. Sales in the second quarter hit a record high.
◎Regional trends
| 2Q of FY 12/20 | Ratio to sales | 2Q of FY 12/21 | Ratio to sales | YoY | Difference from previous forecast |
Consolidated Sales | 16,636 | 100.0% | 22,750 | 100.0% | +36.7% | +19.7% |
Domestic | 7,761 | 46.7% | 10,410 | 45.8% | +34.1% | +13.0% |
Overseas | 8,875 | 53.3% | 12,340 | 54.2% | +39.0% | +26.1% |
America | 2,052 | 12.3% | 2,602 | 11.4% | +26.8% | +18.9% |
Europe | 4,734 | 28.5% | 6,495 | 28.5% | +37.2% | +19.8% |
Asia | 2,089 | 12.6% | 3,243 | 14.3% | +55.2% | +49.0% |
*Unit: million yen. The difference from previous forecast is based on a comparison to the forecasts announced in February of 2021.
Both Japan and overseas showed an increase in sales. Asia, especially China showed large growth from the previous forecast.
◎Average exchange rate
| 2Q of FY 12/20 | 2Q of FY 12/21 |
USD | ¥108.27 | ¥107.69 |
EURO | ¥119.30 | ¥129.82 |
(2) Earnings by Segment
①Trends in each segment
| 2Q of FY 12/20 | Ratio to sales | 2Q of FY 12/21 | Ratio to sales | YoY | Difference from previous forecast |
SS Business | 8,048 | 48.4% | 9,961 | 43.8% | +23.8% | +13.3% |
IA Business | 8,176 | 49.1% | 12,218 | 53.7% | +49.4% | +25.8% |
EMS Business | 188 | 1.1% | 328 | 1.4% | +74.5% | +50.5% |
Others | 223 | 1.3% | 242 | 1.1% | +8.5% | -12.0% |
Sales | 16,636 | 100.0% | 22,750 | 100.0% | +36.7% | +19.7% |
SS Business | 398 | 4.9% | 1,199 | 12.0% | +201.3% | - |
IA Business | 630 | 7.7% | 1,445 | 11.8% | +129.4% | - |
EMS Business | 19 | 10.1% | 112 | 34.1% | +489.5% | - |
Others | -32 | - | -20 | - | - | - |
Adjustments | -232 | - | -215 | - | - | - |
Operating profit | 783 | 4.7% | 2,520 | 11.1% | 221.8% | - |
*Unit: million yen. Ratio to sales of Operating profit refers to Sales Profit margin. The difference from previous forecast is based on a comparison to the forecasts announced in February of 2021.
②Trends in each segment and region
| 2Q of FY 12/20 | Ratio to sales | 2Q of FY 12/21 | Ratio to sales | YoY | Difference from previous forecast |
SS: Security | 5,317 | 100.0% | 6,832 | 100.0% | +28.5% | +16.1% |
Japan | 1,133 | 21.3% | 1,197 | 17.5% | +5.6% | +4.1% |
AMERICAs | 1,089 | 20.5% | 1,308 | 19.1% | +20.1% | +12.9% |
EMEA | 2,593 | 48.8% | 3,699 | 54.1% | +42.7% | +25.9% |
Asia | 502 | 9.4% | 628 | 9.2% | +25.1% | -1.4% |
|
|
|
|
|
|
|
SS: Automatic door | 1,894 | 100.0% | 2,139 | 100.0% | +12.9% | +9.4% |
Japan | 991 | 52.3% | 1,026 | 48.0% | +3.5% | +4.6% |
AMERICAs | 481 | 25.4% | 577 | 27.0% | +20.0% | +16.3% |
EMEA | 365 | 19.3% | 474 | 22.2% | +29.9% | +15.3% |
Asia | 57 | 3.0% | 62 | 2.9% | +8.8% | -7.5% |
|
|
|
|
|
|
|
IA:FA | 3,383 | 100.0% | 4,803 | 100.0% | +42.0% | +36.4% |
Japan | 1,671 | 49.4% | 2,136 | 44.5% | +27.8% | +19.0% |
AMERICAs | 51 | 1.5% | 70 | 1.5% | +37.3% | +1.4% |
EMEA | 988 | 29.2% | 1,217 | 25.3% | +23.2% | +12.4% |
Asia | 673 | 19.9% | 1,380 | 28.7% | +105.1% | +140.8% |
|
|
|
|
|
|
|
IA:MVL | 4,792 | 100.0% | 5,666 | 100.0% | +18.2% | +20.5% |
Japan | 2,880 | 60.1% | 2,946 | 52.0% | +2.3% | +15.9% |
AMERICAs | 431 | 9.0% | 630 | 11.1% | +46.2% | +35.8% |
EMEA | 788 | 16.4% | 1,105 | 19.5% | +40.2% | +11.7% |
Asia | 693 | 14.5% | 985 | 17.4% | +42.1% | +39.1% |
|
|
|
|
|
|
|
IA:IPC | - | - | 1,749 | 100.0% | - | +17.2% |
Japan | - | - | 1,733 | 99.1% | - | +16.2% |
AMERICAs | - | - | 16 | 0.9% | - | - |
|
|
|
|
|
|
|
EMS | 189 | 100.0% | 329 | 100.0% | +74.1% | +50.9% |
Japan | 129 | 68.3% | 225 | 68.4% | +74.4% | +52.0% |
AMERICAs | - | - | 1 | 0.3% | - | - |
Asia | 60 | 31.7% | 103 | 31.3% | 71.7% | +47.1% |
*Unit: million yen. The difference from previous forecast is based on a comparison to the forecasts announced in February of 2021.
◎SS Business
Sales and profits increased.
(Security sensor segment)
Sales increased.
* Japan: The sales of outdoor intrusion detectors for security companies and large-scale critical facilities were healthy, resulting in an increase in sales.
* AMERICAs: The sales of products for general housing, business offices and large-scale critical facilities were favorable, resulting in a large increase in sales.
* EMEA: The sales of products for general housing, business offices and large-scale critical facilities were favorable, resulting in a significant increase in sales.
* Asi The sale of products for critical facilities was favorable, resulting in a large increase in sales.
(Automatic door sensor segment)
Sales increased.
* Japan: Due to the steady demand from stores that sell daily necessities and the demand for the sensor for the use of non-contact, the sale to automatic door dealers has increased steadily, resulting in an increase in sales.
* AMERICAs: The sale of products for major automatic door manufacturers in North America was favorable, resulting in a large increase in sales.
* EMEA: The sale of products for major automatic door manufacturers in Europe was favorable, resulting in a large increase in sales.
◎IA Business
Sales and profits increased.
(FA segment)
Sales increased.
* Japan: The sales for the food industry and electric devices, electronics and semiconductor related investments were favorable, resulting in a significant increase in sales.
* EMEA: The sale of displacement sensors for electronic parts was healthy, resulting in a large increase in sales.
* Asi The vigorous capital investment demand in China caused a steady growth in the sale of displacement sensors, resulting in a large increase in sales.
(MVL segment)
Sales increased.
* Japan: The sale for the automotive industry was sluggish, but the sale for electric devices, electronics and semiconductor related investments was healthy, resulting in a slight increase in sales.
* AMERICAs: The continued projects for the medical industry in the North American region and the orders received for semiconductor related investments resulted in a large increase in sales.
* EMEA: The sales for the French subsidiary expanded due to the recovery of economic activities in Europe and product distribution to the United States of America, resulting in a large increase in sales.
* Asi The sale for semiconductor related investments in China expanded, resulting in a large increase in sales.
(3) Financial Conditions and Cash Flow
◎Main BS
| End of Dec.2020 | End of Jun.2021 | Increase/ decrease |
| End of Dec.2020 | End of Jun.2021 | Increase/ decrease |
Current Assets | 33,067 | 36,317 | +3,250 | Current liabilities | 11,421 | 12,801 | +1,380 |
Cash | 14,583 | 15,923 | +1,340 | Payables | 1,961 | 2,593 | +632 |
Receivables | 8,305 | 9,881 | +1,576 | ST Interest Bearing Liabilities | 6,420 | 6,194 | -226 |
Inventories | 8,318 | 8,990 | +672 | Noncurrent liabilities | 3,343 | 3,232 | -111 |
Noncurrent Assets | 14,323 | 14,515 | +192 | LT Interest Bearing Liabilities | 232 | 38 | -194 |
Tangible Assets | 6,167 | 6,540 | +373 | Net defined benefit liabilities | 1,289 | 1,286 | -3 |
Intangible Assets | 3,742 | 3,459 | -283 | Liabilities | 14,765 | 16,034 | +1,269 |
Investment, Others | 4,413 | 4,516 | +103 | Net Assets | 32,625 | 34,798 | +2,173 |
Total assets | 47,390 | 50,833 | +3,443 | Total Liabilities and Net Assets | 47,390 | 50,833 | +3,443 |
*Unit: million yen
Total assets were 50,833 million yen, up 3,443 million yen from the end of the previous term, due to an increase in cash, receivables and etc.
Total liabilities went up 1,269 million yen from the end of the previous term to 16,034 million yen because, in part, the amount of payables increased while the amount of borrowings dropped.
Net assets were 34,798 million yen, up 2,173 million yen from the end of the previous term, due to an increase in retained earnings, etc.
The equity ratio was 68.0%, down 0.4 point from the end of the previous fiscal year.
◎Cash Flow
| 2Q of FY 12/20 | 2Q of FY 12/21 | Increase/decrease |
Operating CF | 1,865 | 2,298 | +433 |
Investing CF | -671 | -636 | +35 |
Free CF | 1,194 | 1,662 | +468 |
Financing CF | -569 | -1,079 | -510 |
Cash and equivalents | 12,797 | 15,588 | +2,791 |
*Unit: million yen
The surpluses of the operating and free CFs became larger owing partly to an increase in quarterly net profit before taxes.
The deficit of the financing CF widened due to such factors as a decrease in borrowings and payment of dividends.
The cash position increased.
3. Fiscal Year Ending December 2021 Earnings Forecasts
(1) Earnings forecast
| FY 12/20 | Ratio to sales | FY 12/21 Est. | Ratio to sales | YoY | Revision rate | Progress rate against the full year |
Sales | 34,846 | 100.0% | 45,000 | 100.0% | +29.1% | +12.5% | 50.6% |
Operating Profit | 2,098 | 6.0% | 4,500 | 10.0% | +114.4% | +50.0% | 56.0% |
Ordinary Profit | 2,176 | 6.2% | 4,800 | 10.7% | +120.5% | +50.0% | 59.2% |
Net Profit | 1,395 | 4.0% | 3,350 | 7.4% | +140.1% | +52.3% | 57.3% |
*Unit: million yen.
Earnings results were largely revised upward
The company revised its full-year business forecasts based on the powerful performance in the first half. Sales and operating profit are projected to grow by 29.1% and 114.4% year on year to 45 billion yen and 4.5 billion yen, respectively. Sales is expected to rise by double digits in all the regions and all the company’s major business segments. Sanritz Automation, which was acquired as a subsidiary, is expected to make a sales contribution of about 3.5 billion yen. In the third and subsequent quarters, the assumed currency exchange rate remains 105 yen for a dollar. The exchange rate for a euro has been changed from 120 yen to 125 yen. There is no change in the dividend estimate. The company plans to pay a dividend of 30.00 yen per share, unchanged from the previous term. The estimated payout ratio is 32.4%.
◎Regional trends
| FY 12/20 | Ratio to sales | FY 12/21 Est. | Ratio to sales | YoY | Revision rate | Progress rate against the full year |
Consolidated sales | 34,846 | 100.0% | 45,000 | 100.0% | +29.1% | +12.5% | 50.6% |
Domestic | 15,494 | 44.5% | 21,299 | 47.3% | +37.5% | +10.8% | 48.9% |
International | 19,352 | 55.5% | 23,701 | 52.7% | +22.5% | +14.0% | 52.1% |
AMERICAs | 4,402 | 12.6% | 5,109 | 11.4% | +16.1% | +10.6% | 50.9% |
Europe | 10,428 | 29.9% | 12,599 | 28.0% | +20.8% | +15.2% | 51.6% |
Asia | 4,522 | 13.0% | 5,993 | 13.3% | +32.5% | +14.7% | 54.1% |
*Unit: million yen.
(2) Trends in each segment
①Sales of each segment
| FY 12/20 | Ratio to sales | FY 12/21 Est. | Ratio to sales | YoY | Revision rate | Progress rate against the full year |
SS Business | 17,398 | 49.9% | 20,388 | 45.3% | +17.2% | +10.3% | 48.9% |
IA Business | 16,488 | 47.3% | 23,490 | 52.2% | +42.5% | +14.5% | 52.0% |
EMS Business | 472 | 1.4% | 570 | 1.3% | +20.8% | +29.0% | 57.5% |
Others | 488 | 1.4% | 552 | 1.2% | +13.1% | -2.8% | 43.8% |
Consolidated sales | 34,846 | 100.0% | 45,000 | 100.0% | +29.1% | +12.5% | 50.6% |
*Unit: million yen.
②Trends in each segment and region
| FY 12/20 | Ratio to sales | FY 12/21 Est. | Ratio to sales | YoY | Revision rate | Progress rate against the full year |
SS: Security | 11,549 | 100.0% | 13,724 | 100.0% | +18.8% | +12.1% | 49.8% |
Japan | 2,312 | 20.0% | 2,708 | 19.7% | +17.1% | +8.4% | 44.2% |
AMERICAs | 2,255 | 19.5% | 2,639 | 19.2% | +17.0% | +8.6% | 49.6% |
EMEA | 5,752 | 49.8% | 7,035 | 51.3% | +22.3% | +17.6% | 52.6% |
Asia | 1,230 | 10.7% | 1,342 | 9.8% | +9.1% | +0.7% | 46.8% |
|
|
|
|
|
|
|
|
SS: Automatic door | 3,938 | 100.0% | 4,477 | 100.0% | +13.7% | +9.2% | 47.8% |
Japan | 2,030 | 51.5% | 2,228 | 49.8% | +9.8% | +7.6% | 46.1% |
AMERICAs | 999 | 25.4% | 1,180 | 26.4% | +18.1% | +10.7% | 48.9% |
EMEA | 783 | 19.9% | 914 | 20.4% | +16.7% | +11.5% | 51.9% |
Asia | 126 | 3.2% | 155 | 3.5% | +23.0% | +9.2% | 40.0% |
|
|
|
|
|
|
|
|
IA:FA | 7,307 | 100.0% | 9,115 | 100.0% | +24.7% | +22.3% | 52.7% |
Japan | 3,436 | 47.0% | 4,183 | 45.9% | +21.7% | +30.3% | 51.1% |
AMERICAs | 109 | 1.5% | 159 | 1.7% | +45.9% | 0.0% | 44.0% |
EMEA | 2,264 | 31.0% | 2,424 | 26.6% | +7.1% | +10.6% | 50.2% |
Asia | 1,498 | 20.5% | 2,349 | 25.8% | +56.8% | +24.3% | 58.7% |
|
|
|
|
|
|
|
|
IA:MVL | 9,181 | 100.0% | 10,805 | 100.0% | +17.7% | +8.8% | 52.4% |
Japan | 5,233 | 57.0% | 5,741 | 53.1% | +9.7% | +2.7% | 51.3% |
AMERICAs | 1,039 | 11.3% | 1,114 | 10.3% | +7.2% | +15.6% | 56.6% |
EMEA | 1,629 | 17.7% | 2,226 | 20.6% | +36.6% | +14.7% | 49.6% |
Asia | 1,280 | 13.9% | 1,724 | 16.0% | +34.7% | +20.2% | 57.1% |
|
|
|
|
|
|
|
|
IA:IPC | - | - | 3,570 | 100.0% | - | +14.0% | 49.0% |
Japan | - | - | 3,554 | 99.6% | - | +13.5% | 48.8% |
AMERICAs | - | - | 16 | 0.4% | - | - | - |
|
|
|
|
|
|
|
|
EMS | 472 | 100.0% | 570 | 100.0% | +20.8% | +29.0% | 57.7% |
Japan | 338 | 71.6% | 369 | 64.7% | +9.2% | +17.9% | 61.0% |
AMERICAs | - | - | 1 | 0.2% | - | - | - |
Asia | 134 | 28.4% | 200 | 35.1% | +49.3% | +55.0% | 51.5% |
*Unit: million yen.
4. Medium-Term Business Plan
4-1 Medium-term Managerial Goals
Under its business philosophy, “We aim to become a corporate group full of Venture Spirit!” OPTEX GROUP is taking on another challenge to generate sales of 50 billion yen in the fiscal year ending December 2023.
It revised the full-year business forecast for the fiscal year ending December 2021 upward, delivering a business performance stronger than the initial forecast. The company strives to achieve sales of 50 billion yen, a goal set for the final fiscal year, ahead of schedule.
4-2 Three Pillars of Management Strategy
In order to achieve the goals of the medium-term management plan, it is necessary to further strengthen the group management, and the company havs positioned "Business Gowth," "Strengthening Manufacturing Systems," and "Strengthening the Management System" as the three pillars of management strategy.
①Business Growth -Evolution of business model, M&A strategy-
We will pursue sales and profit growth through a three-tiered structure: further growth of existing businesses (SS and IA businesses), growth through evolution of the business model from the sale of products to the sale of solutions and services, and acceleration of growth through M&A, etc.In the "Growth through evolution of business model from mono- to multi-selling", the following initiatives will be promoted in the SS and IA businesses.
*SS Business:Security Sensor segment
The company will expand sales of its image verification solutions in the United States and Europe. It will provide not only sensors but systems as well.
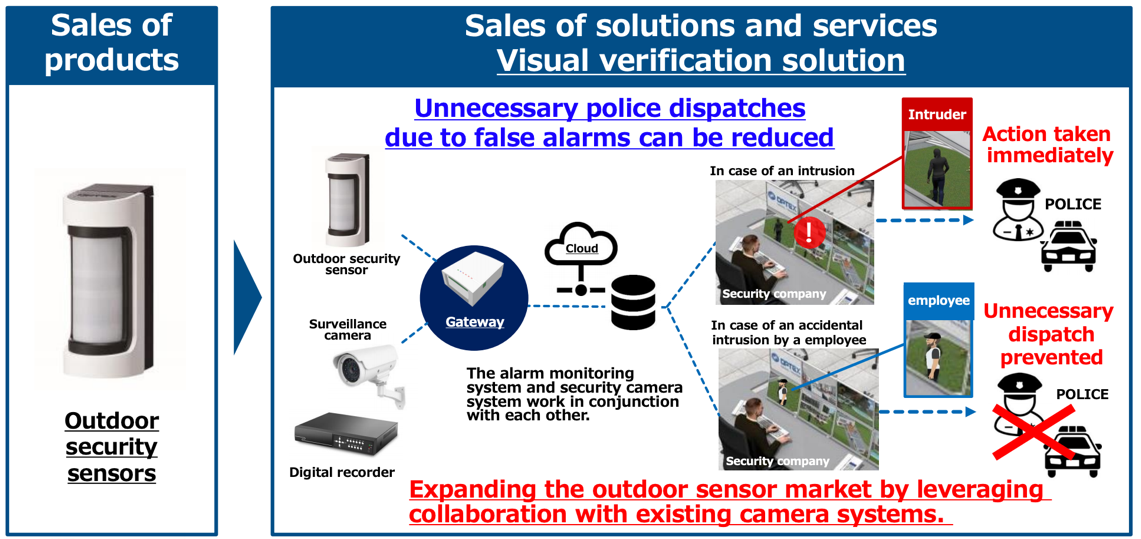
(Taken from the reference material of the company)
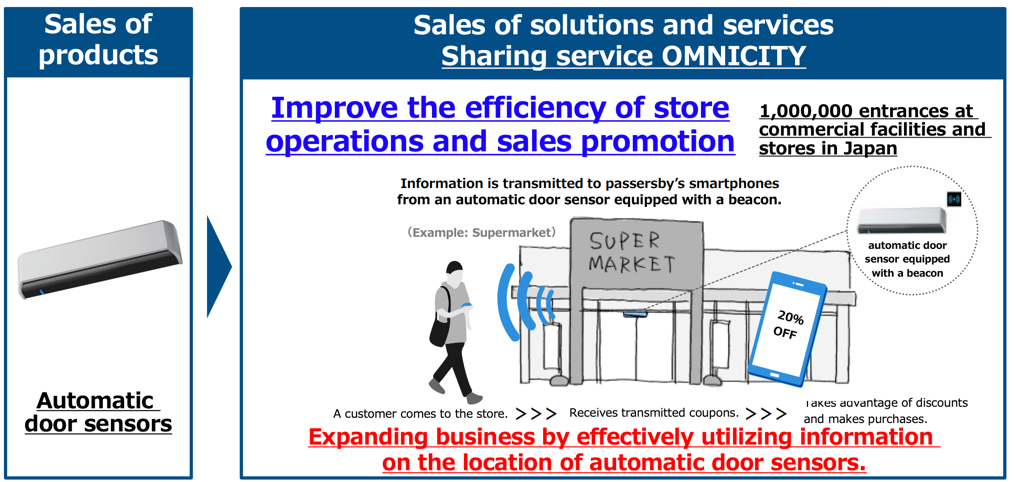
*SS Business: Automatic Door Sensor Segment
The company will expand its Data Service Business using its advantage of occupying 50% of the domestic market.
The company launched a sharing service, OMNICITY, in February of this year.
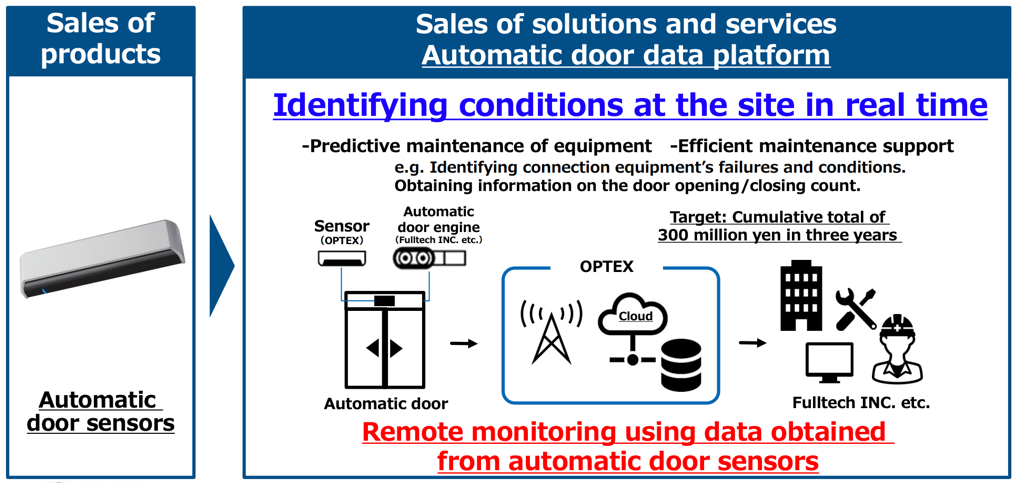
(Taken from the reference material of the company)
(Taken from the reference material of the company)
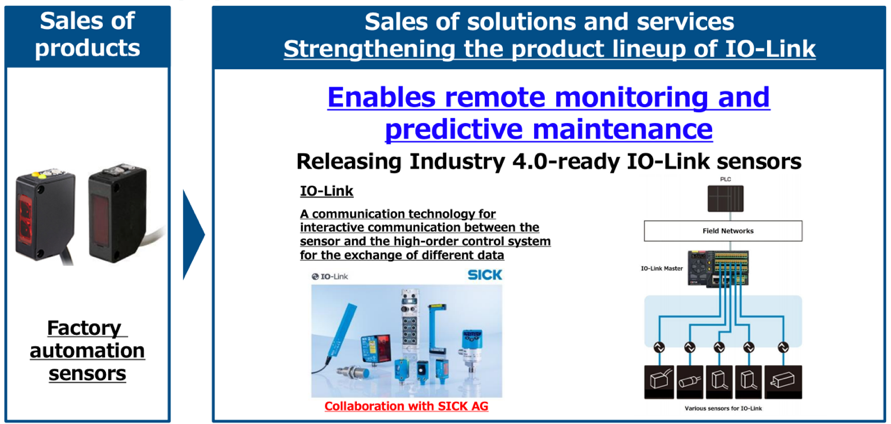
*IA Business:FA segment
The company will further promote cooperation with SICK AG, the world’s leading sensor manufacturer.
(Taken from the reference material of the company)
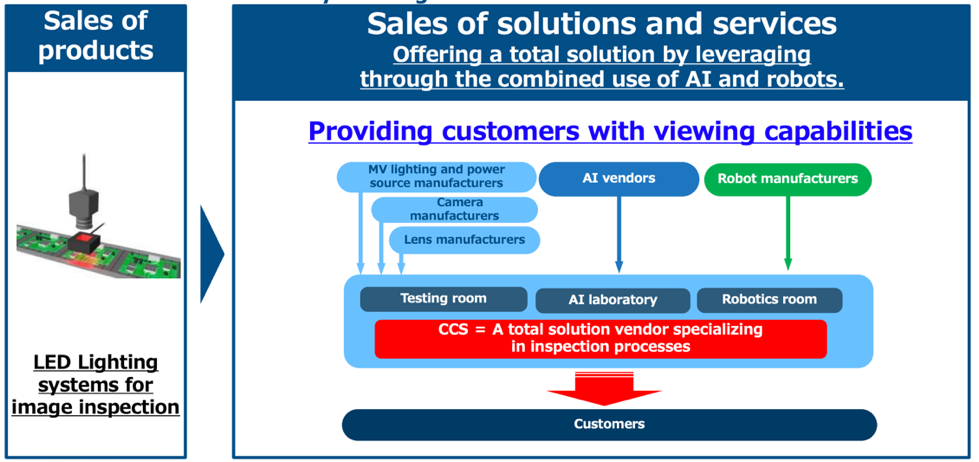
*IA Business (Machine Vision Lighting (MVL) segment)
The company proposes comprehensive solutions by using AI and robots to cultivate data in the field of visual inspection that is currently performed with the human eye.
(Taken from the reference material of the company)
② Strengthening Manufacturing System — Cost reduction through group synergy
In June 2021, the company placed the engineering department, the research and development department, the production department, and the quality assurance department of OPTEX MFG CO., LTD., and CCS Inc. in the same location.
While OPTEX MFG engages primarily in providing mass-produced products by manufacturing sensors for security, automatic doors, and factory automation, CCS mainly offers custom-made products by manufacturing LED lights for image inspection.
Taking advantage of the difference in the product characteristics between the two companies, OPTEX GROUP shares their know-how and implements measures for improving quality, cost, delivery (QCD), such as reduction of the cost of parts and processing costs.
③ Strengthening the Management System — Improvement of the unifying power as the holding company
The holding company OPTEX GROUP will serves as a control tower to conduct business operations that will further raise the corporate value when they are carried out from a group-wide viewpoint among the operations conventionally run by each of the group companies.
Starting off with adopting a cash management system (CMS), the company aims to cut down on cost by integrating indirect operations through adoption of shared services.
It will also enhance its group management structure by focusing on understanding the group-wide business conditions, strengthening the strategic planning functions and management power, and minimizing risks.
OPTEX GROUP aims to continuously achieve management indexes such as a sales growth rate of over 10%, a rate of operating profit on sales of over 15%, and a return on equity (ROE) of over 10%, which it has considered to be important, by enhancing management capabilities.
Giving a particular focus to one of the indexes, a rate of operating profit on sales of over 15%, the company projects that the cost of goods sold and the SG&A ratio will account for 45% and 40%, respectively, of the total cost.
5. Conclusions
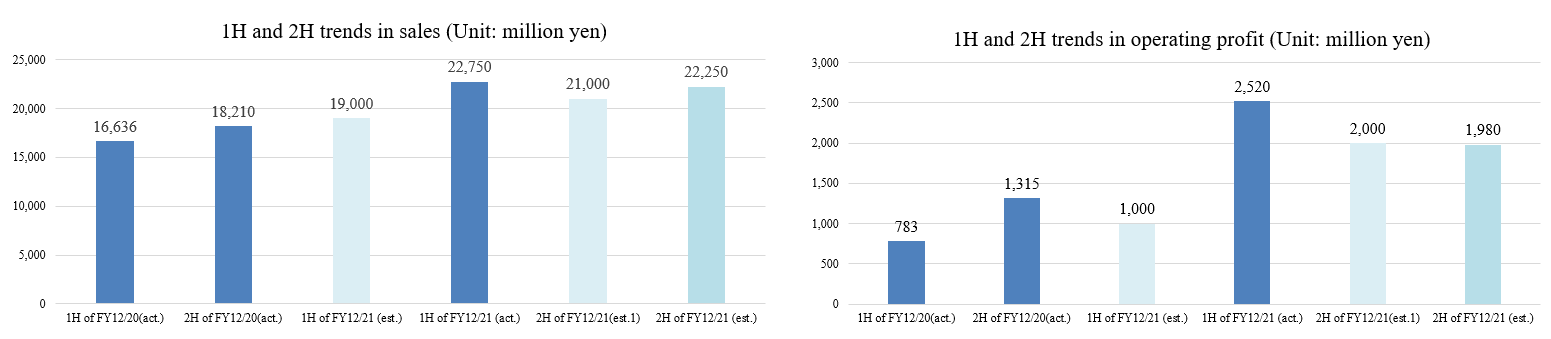
In the current term that is the first step in taking on another challenge to generate sales of 50 billion yen, the company made an extensive upward revision to the full-year business forecast as the business results in the first half exceeded the initial forecast for the businesses related mainly to factory automation. In the second half, however, sales and profit are expected to shrink when compared with those of the first half although they both will increase by 22% and 51%, respectively, when compared with the sales and profit of the same period of the year before. The company gives a conservative forecast because it anticipates that components will be in short supply.
Although factors behind uncertainty amid the novel coronavirus pandemic are still at play, a growing number of people have received vaccination against the disease across the world, which has improved the situation from the profound insecurities in the previous year. Under these circumstances, we would like to keep an eye on whether OPTEX GROUP will be able to solidify its business foundation for boosting sales in the third and ensuing quarters and achieving the objective of the medium-term business plan, which is sales of 50 billion yen in the final fiscal year (ending December 2023), ahead of schedule.
<Reference: Regarding Corporate Governance>
◎Organization type, and the composition of directors and auditors
Organization type | Company with audit and supervisory committee |
Directors | 11directors, including 4 outside ones |
◎Corporate Governance ReportThe latest revision date: March 26, 2021
<Fundamental concept>
As the Group, we recognize that it is our greatest mission to continuously improve corporate value while earning the trust of our shareholders, investors, customers and society. To practice it, we consider enhancement of the corporate governance as one of important management tasks and aim to improve the transparency of management, maintain management systems accompanying fair and prompt decision making and strengthen management monitoring function.
<Reasons for Non-compliance with the Principles of the Corporate Governance Code (Excerpts)>
The company has implemented all of the principles of the Governance Code.
<Disclosure Based on the Principles of the Corporate Governance Code (Excerpts)>
Principle | Items to be disclosed |
Principle 1-4 Cross-Shareholdings | Only if the Company deems it to be strategically conducive to the enhancement of business relationships and increased corporate value for the Group will it acquire shares for cross-shareholding upon discussions and resolutions of the Board of Directors. In addition, the Company examines the significance of cross-shareholdings at a meeting of the Board of Directors every year. If the Company determines it to be rationally pointless to hold certain shares in light of the intended objectives of cross-shareholding, it will sell them in consideration of market trends, etc., thereby endeavoring to reduce such holdings. Listed shares currently held by the Company: One stock amounting to 55 million yen (amount recorded on the balance sheet) With regard to exercising the voting rights it holds, the Company approves or disapproves shareholder proposals based on comprehensive judgment by examining each agenda item individually according to its criteria for exercising voting rights and by taking into consideration whether or not the proposed motion will contribute to the sustained growth of the subject company and the enhancement of corporate value thereof and whether or not the proposed motion will cause significant damage to shareholder value. |
Principle 5-1 Policy for the constructive dialogues with shareholders | To facilitate proactive and constructive dialogue with shareholders, the Company has established a public relations/ IR section and endeavors to provide clear explanations of the Company’s management policy and management situation. In addition, the representative director, president, officer in charge, and public relations/IR personnel systematically hold briefings for institutional investors and briefings for individual investors and field requests for interviews from institutional investors. Moreover, the ordinary general meetings of shareholders are held on Saturdays to ensure the attendance of a wide range of shareholders, and these meetings are followed by briefings for shareholders and social gatherings for shareholders to ensure that they understand the Company’s policies for the future. Note: At the 42nd Ordinary General Meeting of Shareholders, the Company cancelled the social gathering for shareholders to prevent the spread of COVID-19. |
This report is intended solely for information purposes, and is not intended as a solicitation to invest in the shares of this company. The information and opinions contained within this report are based on data made publicly available by the Company, and comes from sources that we judge to be reliable. However, we cannot guarantee the accuracy or completeness of the data. This report is not a guarantee of the accuracy, completeness or validity of said information and or opinions, nor do we bear any responsibility for the same. All rights pertaining to this report belong to Investment Bridge Co., Ltd., which may change the contents thereof at any time without prior notice. All investment decisions are the responsibility of the individual and should be made only after proper consideration. Copyright(C) Investment Bridge Co., Ltd. All rights Reserved. |