Bridge Report:(6914)OPTEX GROUP the second quarter of the fiscal year ending December 2023
![]()
 |
 | OPTEX GROUP CO., LTD. (6914) |
 |
Company Information
Market | TSE Prime Market |
Industry | Electric equipment (Manufacturer) |
Executive Chairman | Isamu Oguni |
President | Tatsuya Nakajima |
HQ Address | 4-7-5, Nionohama, Otsu, Shiga Prefecture |
Year-end | December |
Homepage |
Stock Information
Share Price | Shares Outstanding (Term end) | Total market cap | ROE Act. | Trading Unit | |
1,741yen | 37,735,784shares | 65,697million | 12.8% | 100shares | |
DPS Est. | Dividend yield Est. | EPS Est. | PER Est. | BPS Act. | PBR Act. |
40.00yen | 2.3% | 140.75yen | 12.4x | 1,108.52yen | 1.6x |
*The share price is the closing price in August 9. Shares Outstanding, DPS and EPS was taken from the brief report in 2Q of FY 12/23. ROE and BPS are the results of the previous year.
Earnings Trend
Fiscal Year | Sales | Operating profit | Ordinary profit | Net profit | EPS | DPS |
December 2019 | 37,517 | 2,856 | 2,876 | 2,197 | 60.02 | 32.50 |
December 2020 | 34,846 | 2,098 | 2,176 | 1,395 | 38.59 | 30.00 |
December 2021 | 45,866 | 4,630 | 5,130 | 3,762 | 104.18 | 30.00 |
December 2022 | 54,811 | 6,303 | 7,042 | 4,752 | 133.79 | 36.00 |
December 2023 Est. | 57,000 | 6,500 | 6,900 | 5,000 | 140.75 | 40.00 |
Net profit is net profit attributed to parent shareholders. The same applies hereafter.
This Bridge Report presents OPTEX GROUP’s earnings results for the second quarter of the fiscal year ending December 2023 and so on.
Table of Contents
Key Points
1. Company Overview
2. Second quarter of Fiscal Year Ending December 2023 Earnings Results
3. Fiscal Year Ending December 2023 Earnings Forecasts
4. Growth Strategies Initiatives
5. Conclusion
<Reference 1: Three-Year Management Plan>
<Reference 2: Regarding Corporate Governance>
Key Points
- In the second quarter of the fiscal year ending December 2023, sales decreased 0.2% year on year to 27.1 billion yen. Due to the uncertainty of the economic outlook, customers in Japan and overseas are refraining from investing. The SS business was affected by the postponement of large-scale overseas projects, and the IA business was affected by the curtailment of semiconductor-related capital investment and inventory adjustments by customers. Exchange rates made a positive contribution of 1.1 billion yen. Operating profit decreased 25.9% year on year to 2.6 billion yen. Gross profit was almost unchanged from the same period of the previous year due to the decline in sales. SG&A expenses increased 9.0% year on year as a result of aggressive sales activities and improving sales promotions to achieve the three-year (2023-2025) management plan. Exchange rates made a positive contribution of 0.4 billion yen.
- The full-year earnings forecast for the fiscal year ending December 2023 has been revised downwardly. This was due to the company receiving requests from customers to postpone the shipment of products because of the impact of limiting capital investment in the semiconductor industry in the FA segment and the MVL segment of the IA business and the postponement of large-scale projects in the U.S. despite the firm sales in Europe in the security segment of the SS business in the first half of the fiscal year. Sales are expected to rise 4.0% year on year to 57 billion yen, and operating profit is forecast to rise 3.1% year on year to 6.5 billion yen. Even after the revision, it is expected that sales and operating profit will increase for the third consecutive year. From the third quarter onward, the company predicts orders for highly profitable products to improve in both the IA and SS businesses. There is no change in the dividend forecast. The company plans to raise the dividend by 4 yen/share from the previous term to 40.00 yen/share. The expected dividend payout ratio is 28.4%.
- Under the group's corporate philosophy of "We aim to become a corporate group full of Venture Spirit," the company aspires to achieve an operating profit of 10 billion yen or more and an operating profit margin of 14% in 2025 and has positioned "business model transformation" at the core of its growth strategy. The company is making a shift from conventional single-product sales to solution sales, which includes "expanding the direct marketing strategy" in the SS business, "promoting the challenger strategy" in the IA business (FA segment), and "evolving into a total solution vendor" in the IA business (MVL segment).
- The full-year earnings forecast has been revised downwardly due to requests for postponing product shipments in the IA business (FA and MVL segments) and postponement of large-scale projects in the SS business (security segment). However, sales in the SS business (security segment) have been revised upwardly, albeit by a small amount. Thus, the focus of the full-year outlook will be the trend in the IA business (FA segment), where sales have decreased from the previous quarter for four consecutive quarters. In particular, sales in Japan hovered around 1 billion yen, while sales in Asia and Oceania, centered on China, were 683 million yen in the second quarter (April-June), which was only 70% of the 927 million yen in the second quarter (April-June) of the fiscal year ended December 2022, the company's peak. The company expects that the slowdown in capital investment for secondary batteries will continue for the rest of the year, but we would like to pay attention to capital investment trends in the third and fourth quarters.
1.Company Overview
OPTEX GROUP Co., Ltd. is a holding company centered around OPTEX Co., Ltd. that manufactures and sells outdoor sensors (top share of 40% in the global market), automatic door sensors (30% share of the global market and 50% share of the domestic market) and environment-related products.
OPTEX GROUP holds subsidiaries including OPTEX FA CO., LTD., which deals with FA related sensing business; CCS Inc., which holds the global top share in the LED lighting business for image processing; Sanritz Automation Co., Ltd., which has a wealth of results in the development, manufacturing and sales of industrial computers, MITSUTEC CO., LTD., which plans, develops, manufactures, and sells image processing, inspection, and measuring equipment and automated machinery and equipment, contributing to the improvement in quality of manufacturing with its advanced technologies (included in the scope of consolidation from the fiscal year ending December 2022), Three Ace Co., Ltd., which specializes in the development of various systems, applications, and digital content; OPTEX MFG Co., Ltd., which is responsible for manufacturing Group products, RAYTEC LIMITED (UK), which has attained the largest global share (about 50 %) for supplemental lights for CCTV; and FIBER SENSYS INC. (US), which deals with optical fiber intrusion detection systems.
As of December 31, 2022, the company operates in 90 locations worldwide, including 29 overseas companies.
OPTEX CO., LTD. | Develops and sells sensors for various uses, such as security sensors and sensors for automatic doors |
OPTEX FA CO., LTD. | Development and sales of photoelectric sensors, image inspection systems, displacement sensors and measuring instruments |
CCS Inc. | Development, manufacturing and sales of LED lighting devices, and systems for image processing |
Sanritz Automation Co., Ltd. | Development, manufacturing, and sales of industrial computers |
MITSUTEC CO., LTD. (Included in the scope of consolidation from the fiscal year ended December 2022) | Development, manufacturing, and sale of image processing, inspection, and measuring equipment and automated machinery and equipment |
THREE ACE CO., LTD. | Development of various systems, applications, and digital content |
OPTEX MFG CO., LTD. | Manufactures products for the Group and provides contract manufacturing service for electronic equipment |
SICK OPTEX CO., LTD. | Development of general-purpose photoelectric sensors. A joint venture of SICK AG (Germany) and OPTEX FA CO., LTD. |
GIKEN TRASTEM CO., LTD. | Development, manufacturing, and sales of people counting systems, customer traffic counting/management systems |
ZENIC INC. | Contracted development of IC and LSI for image processing, and design and sales of FA systems |
O’PAL OPTEX CO., LTD. | Management of outdoor activities and environmental hands-on learning programs |
FIBER SENSYS INC. (US) | Development, manufacturing, and sales of fiber-optic intrusion detection systems |
FARSIGHT SECURITY SERVICES LTD. (UK) | Security company providing remote video surveillance services |
RAYTEC LIMITED (UK) | Development, manufacturing, and sales of supplemental lighting for surveillance cameras |
GARDASOFT VISION LIMITED (UK) | Development, manufacturing, and sale of LED lighting controllers for machine vision |
1-1 Corporate History
In May 1979, Mr. Toru Kobayashi (currently serving as a director and senior corporate adviser), who was developing security sensors in a manufacturer of anti-crime devices in Kyoto, established OPTEX Co., Ltd. with the spirit of the endeavor to “make their products recognized in the world as much as possible.”
In November 1979, the company developed “the world’s first far-infrared sensor for automatic doors.” Around that time, pressure-sensitive rubber mats were used for automatic doors, and an automatic door sensor that utilizes far-infrared light was epoch-making. OPTEX was unrivaled in maintenance and installation services and seized the largest share in the market of automatic door sensors in the third year after inauguration (currently occupying about 50% of the Japanese market).
Since then, the company has developed a wide array of products for security, automatic doors, and industrial equipment with its unique ideas and technologies that embodies them.
In the 1980s, the company entered overseas markets. While it had been considered impossible to set a far-infrared sensor outdoors because external factors, such as light, would cause errors, the company developed the outdoor far-infrared sensor “VX-40” with its original technology, and that sensor was highly evaluated mainly in the European market, and occupied the largest share in the global market of outdoor intrusion detection sensors.
Through business expansion, the company became an over-the-counter company (equivalent to being listed in the JASDAQ market) in 1991. Then, it was listed in the second section of Tokyo Stock Exchange (TSE) in 2001, and in the first section of TSE in 2003.
In April 2022, the company was listed on the Prime Market following the restructuring of the Tokyo Stock Exchange.
Recently, the company has been strengthening solutions based on image processing technologies and high-end security systems. In 2008, it reorganized ZENIC INC., which undertakes the development of ICs and LSI for image processing, etc., into a subsidiary. In 2010, it acquired FIBER SENSYS INC. (US), which has plenty of experience handling high-end security systems (optical fiber intrusion detection systems) for important facilities in Europe and the U.S., as a subsidiary. In 2012, it acquired RAYTEC LIMITED (UK), which handles supplemental lighting for cameras of high-end security systems for important large-scale facilities, as a subsidiary.
In May 2016, it acquired CCS Inc., which has the world’s largest share in the market of LED lighting for image processing, as a subsidiary, and transformed it into a 100% subsidiary in July 2018.
With the aim of adopting next-generation business administration and pursuing group synergy, it shifted to the holding company system on January 1, 2017.
In December 2020, the company acquired Sanritz Automation Co., Ltd., which has an abundance of experience in developing, manufacturing, and selling industrial computer systems, as a subsidiary. Furthermore, the company made MITSUTEC CO., LTD. into a subsidiary in November 2021. MITSUTEC CO., LTD. is a company that plans, develops, manufactures, and sells image processing inspection / measuring equipment and automated machinery and equipment. The company is promoting a three-year medium-term management plan (2023-25), and part of the measures to achieve this plan is business model transformation and strengthening its ability to propose solutions to achieve further growth as a leading company in the global niche market.
1-2 Business Description
The Company’s business is composed of its main SS business (security sensor segment and automatic door sensor segment), sensors for industrial machinery, LED lighting device and system for image processing, the “IA Business” which works towards the automation, labor saving, and optimization of the production line using industrial computers, “EMS business,” which was included in the SS business up until the previous term and provides contract manufacturing services for electronic equipment in China, and “Other business”, which operates programs for outdoor activities and experiencing and learning of the environment and develops apps and digital content.
Segment | Business Description | |
SS Business | Security Sensor segment | Main products include various indoor and outdoor sensors, wireless security systems and LED lighting control systems, etc. For outdoor sensors, the company has the leading share in the global market. Recently, it focused on development of the automobile detection sensor using microwave technologies. |
Automatic Door Sensor segment | The company developed the world’s first automatic door sensor using infrared rays. Main products are automatic door opening/closing sensors, shutter sensors for factories, wireless touch switches, etc. | |
Other | Equipment for measuring water quality. Customer traffic counting/management systems, developing/marketing of image processing-related products. | |
IA Business | FA segment | Main products include photoelectric sensors used for quality control and automation of production lines, displacement sensors, image sensors, LED lights, etc. In Japan, these products are provided to a wide range of industries such as food or pharmaceutical for quality control of production lines. In Europe, its products on an OEM basis through its technological partner SICK AG (Germany) that has the largest share in industrial sensor market. Also, its house-brand products have been launched in Asia and North America. |
MVL segment | The company has a significant share in the LED lighting business for image processing. The company offers solutions using the natural light LED developed by the company, which boasts the best color rendering property in the field. | |
IPC segment | The company has shown great results in the development, manufacturing, and sale of industrial computers. Specializes in the development of devices and systems that require both “hardware” and “software” of industrial built-in computers. | |
MECT segment | The company possesses advanced mechatronics technologies, such as high-speed and high-precision filling and high-speed conveyance technologies and provides high-quality automation equipment that meets strict requirements. Regarding image processing inspection and measurement equipment, the company has built an image processing inspection system for dealing with customers' issues. | |
EMS Business | Contract manufacturing services for electronic equipment, developed at a factory in China. | |
Others | Operating outdoor activities and environmental hands-on learning programs and development of applications and digital content. | |
*SS:Sensing Solution、IA:Industrial Automation、FA:Factory Automation、MVL:Machine Vision Lighting、IPC:Industrial PC 、MECT:Mechatronics、EMS:Electronics Manufacturing Service。
1-3 Advantages: Diversified Technologies/Expertise on Sensing and Unique Sensing Algorithm
To produce stable and reliable sensors, it is essential to build on a number of elemental technologies and expertise, as well as “algorithms” to control physical changes. The company takes advantage of its technologies/expertise suitable for intended applications and its unique sensing algorithm to secure the largest share in the global market.
Noise abatement technology | ・Hardware design to minimize various noises ・Conduct a number of environmental assessments based on its own standard, and launch products that passed the assessments |
Sophisticated optical design | ・Make use of optical simulation to achieve high-density areas eliminating blind spots ・Packaging technologies to enable downsizing |
Compliant to public standards for reliability | ・Adapted and compliant to any global standards ・Adapted and compliant to industry standards and guidelines (CE marking, EN standard [TUV certified], ANSI, JIS, etc.) |
Environment friendly design | ・By identifying 15 restricted-use materials and 10 self-control materials, the company succeeded in excluding toxic substances in all products ・Compliant to RoHS directive, lead-free solder alloy ・Design to minimize the effect from CO2 when in use |
Secure & safe control | ・Adopt self-diagnosis functions in emergency or in failure to prevent system outage, and fail-safe devices for sensors ・Propose preventive maintenance measures to maintain functions |
Unique sensing algorithm | ・Unique algorithm to eliminate the impact of noise ineliminable by hardware, detect, scan and analyze only the intended events ・Various automatic correction functions to maintain performance in the field |
High market share | The company has a high share in unique products with their motto, “global niche No. 1.” Outdoor intrusion detection sensors: 40% Sensors for automatic doors: 30% LED lighting for image inspections: 30% |
1-4 ROE analysis
| FY12/ 13 | FY12/ 14 | FY12/ 15 | FY12/ 16 | FY12/ 17 | F 12/ 18 | FY12/ 19 | FY12/ 20 | FY12/ 21 | FY12/ 22 |
ROE (%) | 8.2 | 8.6 | 8.7 | 7.4 | 12.6 | 12.3 | 6.8 | 4.3 | 11.2 | 12.8 |
Net Income Margin (%) | 6.87 | 7.39 | 7.38 | 5.83 | 9.03 | 9.41 | 5.86 | 4.00 | 8.20 | 8.67 |
Asset turnover (times) | 0.92 | 0.89 | 0.91 | 0.91 | 0.95 | 0.95 | 0.86 | 0.76 | 0.87 | 0.91 |
Leverage (times) | 1.30 | 1.31 | 1.30 | 1.41 | 1.48 | 1.38 | 1.35 | 1.41 | 1.56 | 1.63 |
The company recorded a double-digit ROE in the fiscal year ended December 2022, like in the previous fiscal year. It is aiming for an operating profit margin of 15% or more in its Mid-term and Long-term Management Plan. Under this aim, it will promote cost efficiencies and a transformation from selling goods to selling things with the aim of reliably improving its ROE and maintaining it to at least 10%.
1-5 Efforts on ESG
The company believes that building a relationship of trust with a wide range of stakeholders is essential for improving corporate value and has posted 「ESG information」(https://www.optexgroup.co.jp/en/esg/stakeholder.html)on its website to further enhance ESG information disclosure. In addition, Published the ESG Bridge Report through Investment Bridge Inc.
The company identify the materiality for sustainable growth for the first time and mention the challenges and initiatives for the future in the report.
Posted on June 6, 2023.
https://www.bridge-salon.jp/report_bridge/archives/eng/6914/20230620.html
2.Second quarter of Fiscal Year Ending December 2023 Earnings Results
2-1 Business Results
| 2Q of FY 12/22 | Ratio to sales | 2Q of FY 12/23 | Ratio to sales | YoY | 2Q of FY 12/22 |
Sales | 27,241 | 100.0% | 27,197 | 100.0% | -0.2% | -6.9% |
Gross profit | 13,930 | 51.1% | 13,926 | 51.2% | -0.0% | - |
SG&A | 10,340 | 38.0% | 11,266 | 41.4% | +9.0% | - |
Operating profit | 3,590 | 13.2% | 2,659 | 9.8% | -25.9% | -26.1% |
Ordinary profit | 4,297 | 15.8% | 2,931 | 10.8% | -31.8% | -19.7% |
Quarterly net Profit | 3,120 | 11.5% | 1,985 | 7.3% | -36.4% | -22.2% |
*Unit: million yen. The quarterly net profit is the profit attributable to owners of the parent company. The same shall apply hereinafter.
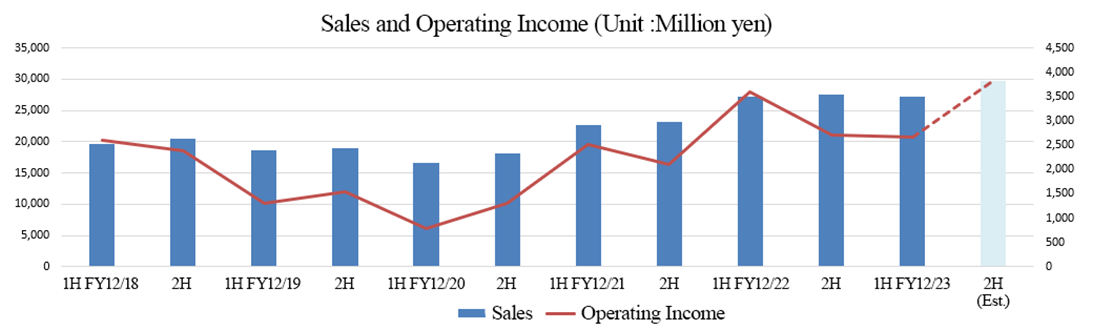
Sales flat year-on-year, profit down
In the second quarter of the fiscal year ending December 2023, sales decreased 0.2% year on year to 27.1 billion yen. Due to the uncertainty of the economic outlook, customers in Japan and overseas are refraining from investing. The SS business was affected by the postponement of large-scale overseas projects, and the IA business was affected by the curtailment of semiconductor-related capital investment and inventory adjustments by customers. Exchange rates made a positive contribution of 1.1 billion yen. Operating profit decreased 25.9% year on year to 2.6 billion yen. Gross profit was almost unchanged from the same period of the previous year due to the decline in sales. SG&A expenses increased 9.0% year on year as a result of aggressive sales activities and improving sales promotions to achieve the three-year (2023-2025) management plan. Exchange rates made a positive contribution of 0.4 billion yen.
◎Trends in each quarter
On a quarterly basis, sales increased and profit decreased year on year, while sales and profit dropped quarter on quarter.
◎Regional trends
| 2Q of FY 12/22 | Ratio to sales | 2Q of FY 12/23 | Ratio to sales | YoY | Forecast ratio |
Consolidated Sales | 27,241 | 100.0% | 27,197 | 100.0% | -0.2% | -6.9% |
Domestic | 12,207 | 44.8% | 11,811 | 43.4% | -3.2% | -5.7% |
Overseas | 15,034 | 55.2% | 15,386 | 56.6% | +2.3% | -7.7% |
America | 3,421 | 12.6% | 3,665 | 13.5% | +7.1% | -5.1% |
Europe | 7,887 | 29.0% | 8,344 | 30.7% | +5.8% | -3.1% |
Asia | 3,726 | 13.7% | 3,377 | 12.4% | -9.4% | -19.7% |
*Unit: million yen.
Domestic sales decreased. Outside Japan, sales were increased in the Americas and Europe. All regions were below expectations.
◎Average exchange rate
| 2Q of FY 12/22 | 2Q of FY 12/23 |
USD | 122.89 yen | 134.85 yen |
EURO | 134.25 yen | 145.79 yen |
2-2 Earnings by Segment
①Trends in each segment
| 2Q of FY 12/22 | Ratio to sales | 2Q of FY 12/23 | Ratio to sales | YoY | Forecast ratio |
SS Business | 11,509 | 42.2% | 12,096 | 44.5% | +5.1% | -4.1% |
IA Business | 15,036 | 55.2% | 14,448 | 53.1% | -3.9% | -8.4% |
EMS Business | 422 | 1.5% | 363 | 1.3% | -14.0% | -29.9% |
Others | 273 | 1.0% | 288 | 1.1% | +5.5% | -5.9% |
Sales | 27,241 | 100.0% | 27,197 | 100.0% | -0.2% | -6.9% |
SS Business | 1,554 | 13.5% | 1,263 | 10.4% | -18.7% | - |
IA Business | 2,123 | 14.1% | 1,384 | 9.6% | -34.8% | - |
EMS Business | 111 | 26.3% | 272 | 74.9% | +143.3% | - |
Others | 3 | 1.1% | 2 | 0.7% | -33.3% | - |
Adjustments | -203 | - | -263 | - | - | - |
Operating profit | 3,590 | 13.2% | 2,659 | 9.8% | -25.9% | -26.1% |
*Unit: million yen. Ratio to sales of Operating profit refers to Sales Profit margin.
Sales increased and profit declined in the SS business. Sales and profit decreased in the IA business.
②Trends in each segment and region
| 2Q of FY 12/22 | Ratio to sales | 2Q of FY 12/23 | Ratio to sales | YoY | Forecast ratio |
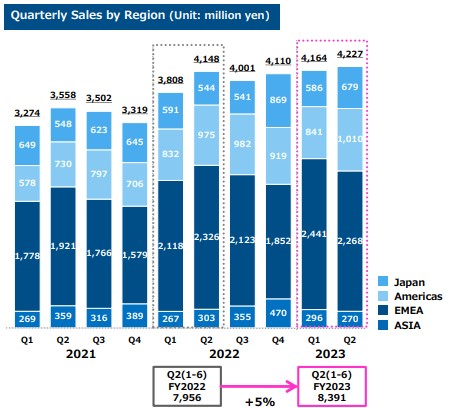
SS: Security | 7,956 | 100.0% | 8,391 | 100.0% | +5.5% | -2.9% |
Japan | 1,135 | 14.3% | 1,265 | 15.1% | +11.5% | -1.2% |
AMERICAs | 1,807 | 22.7% | 1,851 | 22.1% | +2.4% | -8.5% |
EMEA | 4,444 | 55.9% | 4,709 | 56.1% | +6.0% | +3.4% |
Asia・Oceania | 570 | 7.2% | 566 | 6.7% | -0.7% | -28.3% |
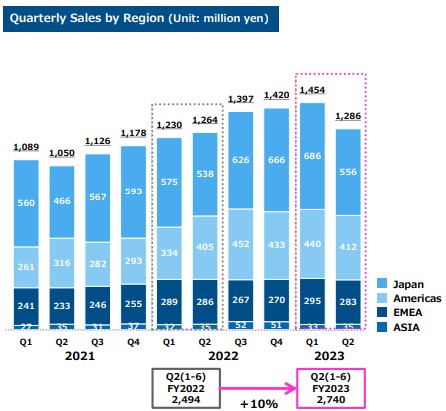
SS: Automatic door | 2,494 | 100.0% | 2,740 | 100.0% | +9.9% | -4.5% |
Japan | 1,113 | 44.6% | 1,242 | 45.3% | +11.6% | +3.1% |
AMERICAs | 739 | 29.6% | 852 | 31.1% | +15.3% | -6.0% |
EMEA | 575 | 23.1% | 578 | 21.1% | +0.5% | -14.6% |
Asia・Oceania | 67 | 2.7% | 68 | 2.5% | +1.5% | -17.1% |
|
|
|
|
|
|
|
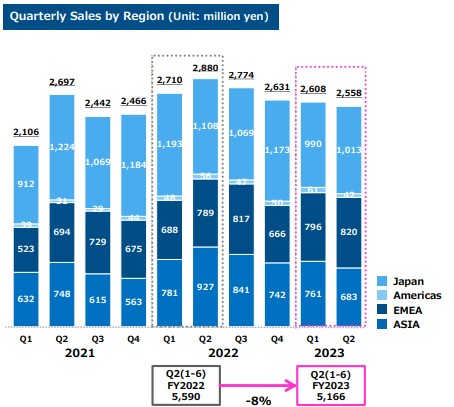
IA:FA | 5,590 | 100.0% | 5,166 | 100.0% | -7.6% | -12.8% |
Japan | 2,301 | 49.2% | 2,003 | 49.7% | -13.0% | -15.7% |
AMERICAs | 104 | 25.9% | 103 | 25.2% | -1.0% | -8.8% |
EMEA | 1,477 | 21.9% | 1,616 | 21.8% | +9.4% | -0.7% |
Asia・Oceania | 1,708 | 2.9% | 1,444 | 3.2% | -15.5% | -20.2% |
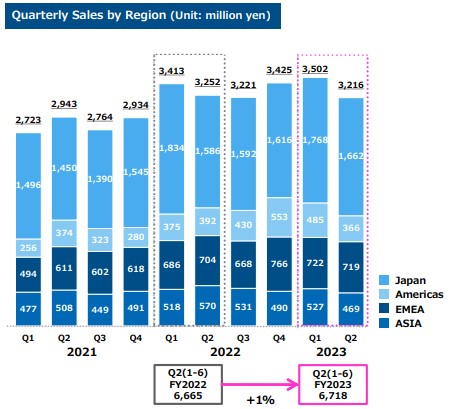
IA:MVL | 6,665 | 100.0% | 6,718 | 100.0% | +0.8% | -8.5% |
Japan | 3,420 | 51.3% | 3,430 | 51.1% | +0.3% | -3.8% |
AMERICAs | 767 | 11.5% | 851 | 12.7% | +11.0% | +4.5% |
EMEA | 1,390 | 20.9% | 1,441 | 21.4% | +3.7% | -17.8% |
Asia・Oceania | 1,088 | 16.3% | 996 | 14.8% | -8.5% | -17.4% |
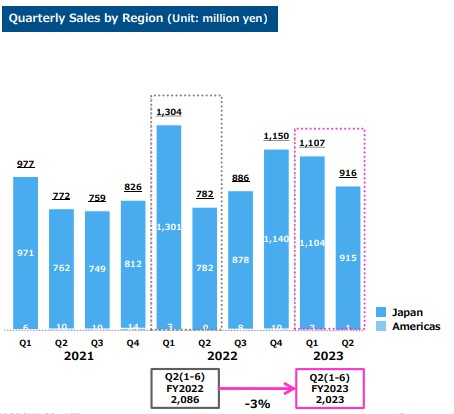
IA:IPC | 2,086 | 100.0% | 2,023 | 100.0% | -3.0% | -12.2% |
Japan | 2,083 | 99.9% | 2,019 | 99.8% | -3.1% | -12.1% |
AMERICAs | 3 | 0.1% | 4 | 0.2% | +33.3% | -20.0% |
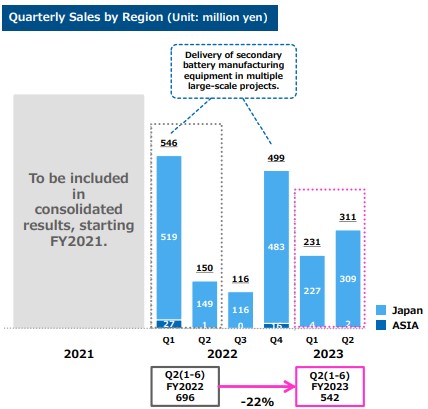
IA:MECT | 696 | 100.0% | 542 | 100.0% | -22.1% | +171.0% |
Japan | 668 | 96.0% | 536 | 98.9% | -19.8% | +168.0% |
AMERICAs | 0 | - | 0 | - | - | - |
Asia・Oceania | 28 | 4.0% | 6 | 1.1% | -78.6% | - |
|
|
|
|
|
|
|
EMS | 422 | 100.0% | 363 | 100.0% | -14.0% | -29.9% |
Japan | 252 | 59.7% | 170 | 46.8% | -32.5% | -46.2% |
AMERICAs | 1 | 0.2% | 1 | 0.3% | 0.0% | - |
Asia・Oceania | 169 | 40.0% | 192 | 52.9% | +13.6% | -5.0% |
*Unit: million yen.
◎SS Business
(Security sensor segment)
Sales increased year on year, and also increased from the second half of the previous year.
*Japan | Sales grew year on year. Sale of outdoor warning sensors and inquiries for large-scale important facilities were firm. |
*AMERICAs | Sales grew year on year. The sale of laser scan sensors at data centers and infrastructure facilities, etc. was favorable owing to the direct marketing strategy. |
*EMEA | Sales grew year on year. Despite products for housing being in an adjustment phase due to the impact of inflation, etc., the sale of camera-equipped sensors and laser scan sensors for commercial establishments was favorable. |
* Asia・Oceania | Sales declined year on year. While the sale of outdoor security sensors remained steady in India and Thailand, the sale in China and Southeast Asia was sluggish due to the impact of worse economic situation. |
(From the company release)
(Automatic door sensor segment)
Sales increased year and year and decreased compared to the previous 2H.
*Japan | Sales grew year on year. As the company’s capability to stably supply products was recognized by major domestic automatic door manufacturers, inquiries were strong. |
*AMERICAs | Sales grew year on year. The sale of both sensors for automatic doors and sensors for shutters was steady. |
*EMEA | Sales grew year on year. Although major automatic door manufacturers in Europe continue to make inquiries, there tends to be less business opportunities due to the decline in business sentiment. |
(From the company release)
◎IA Business
(FA segment)
Sales decreased year on year and quarter on quarter.
*Japan | Sales decreased year on year. Capital investment demand for smartphones and PCs was sluggish, and sales for semiconductors were slow due to inventory adjustments. Inquiries for IO-Link-related products smoothly increased. |
*EMEA | Sales grew year on year. The sale of displacement sensors for electronic parts was strong. |
* Asia・Oceania | Sales decreased year on year. The sale of displacement sensors in China was sluggish due to slowdown in capital investment in rechargeable battery facilities. |
(From the company release)
(MVL segment)
Sales increased both YoY and 2HY.
*Japan | Sales flat year on year. Inquiries for automobile-related products were steady. A private show consisting mainly of the exhibition of solutions garnered positive reviews, resulting in gaining business opportunities. |
*AMERICAs | Sales increased year on year. The company received an order for a project in the logistics industry using the products of the French subsidiary. |
*EMEA | Sales increased year on year. The company received an order for a project in the logistics industry using the products of the French subsidiary. |
*Asia・Oceania | Sales decreased year on year. Sales for semiconductor-related investments were strong in China |
(From the company release)
(IPC segment)
Sales decreased both YoY and 2H YTD.
*Japan | Sales decreased year on year. The sale was sluggish due to delays in product supply caused by the shortage of parts. |
(From the company release)
(MECT segment)
Sales decreased both YoY and 2H YTD.
*Japan | The production system was developed in preparation for the delivery for large transaction of products for manufacturing rechargeable batteries from the third quarter. |
(From the company release)
2-3 Financial Conditions and Cash Flow
◎Main BS
| End of Dec.2022 | End of Jun.2023 | Increase/ decrease |
| End of Dec.2022 | End of Jun.2023 | Increase/ decrease |
Current Assets | 47,932 | 50,259 | +2,327 | Current liabilities | 18,752 | 15,341 | -3,411 |
Cash | 17,287 | 16,856 | -431 | Payables | 3,165 | 3,648 | +483 |
Receivables | 12,221 | 11,445 | -776 | ST Interest Bearing Liabilities | 9,634 | 6,448 | -3,186 |
Inventories | 16,247 | 19,784 | +3,537 | Noncurrent liabilities | 4,814 | 7,687 | +2,873 |
Noncurrent Assets | 15,370 | 15,283 | -87 | LT Interest Bearing Liabilities | 1,247 | 4,076 | +2,829 |
Tangible Assets | 7,621 | 7,778 | +157 | Net defined benefit liabilities | 1,436 | 1,459 | +23 |
Intangible Assets | 2,815 | 2,709 | -106 | Liabilities | 23,567 | 23,028 | -539 |
Investment, Others | 4,932 | 4,796 | -136 | Net Assets | 39,735 | 42,514 | +2,779 |
Total assets | 63,302 | 65,542 | +2,240 | Total Liabilities and Net Assets | 63,302 | 65,542 | +2,240 |
*Unit: million yen
Total assets increased 2,200 million yen from the end of the previous term to 65,500 million yen, due to the growth of inventories, etc. Total liabilities decreased 500 million yen from the end of the previous term to 23,000 million yen, due to the decrease in loans payable, etc.Net assets were 2,700 million yen, up 42,500 million yen from the end of the previous term, due to the increase in retained earnings and foreign currency translation adjustments, etc. The equity ratio was 64.3%, up 2.1 point from the end of the previous fiscal year.
◎Cash Flow
| 2Q of FY 12/22 | 2Q of FY 12/23 | Increase/Decrease |
Operating cash flow | 1,487 | 362 | -1,125 |
Investing cash flow | -690 | -346 | 344 |
Free cash flow | 797 | 16 | -781 |
Financing cash flow | -603 | -1,292 | -689 |
Cash and equivalent | 17,993 | 16,856 | -1,137 |
*Unit: million yen
The surplus in operating CF and free CF shrank due to the decline in net profit before income taxes and other adjustments.
The cash position has declined.
2-4 Topics
◎Business alliance between CCS and iCore
In May 2023, CCS Inc. and iCore Co., Ltd. (headquartered in South Korea), a manufacturer of inspection components, signed a business alliance agreement to create new solutions utilizing the technologies of both companies.
(Overview of iCore)
It was established in 2019. iCore is a company specializing in developing machine vision components, founded by researchers who have developed high-resolution machine vision cameras and TDI cameras and whose technical capabilities have been recognized worldwide. The company's products are capable of high-speed control and high output, and its main product is a strobe controller that can control up to 8 channels. iCore is increasing customer satisfaction by developing products that can meet the diverse needs of customers.
(Overview of the business alliance)
In the image processing inspection, the object to be inspected is imaged, image processing is performed using inspection software, and OK/NG judgment is provided.
In the manufacturing industry, including electronic components and semiconductors, inspection is rapidly becoming faster and more precise, and CCS has recently been focusing on proposing multi-scanning imaging systems to meet new needs.
<Multi-scanning imaging system>
Conventionally, when performing multiple types of inspections on one product, it was necessary to prepare several inspection stages.
The multi-scanning imaging system enables inspection on a single stage by switching multiple illuminations at high speed to capture images, thus improving efficiency by reducing costs, inspection time, and installation space.
In addition, by using the same system, complex image processing, such as the acquisition of images illuminated from different directions or images captured with different wavelengths to the inspection object and performing image processing, becomes easy.
As a result, it is now possible to perform inspections that have been difficult to automate, for example, removing unevenness of the surface of the inspection object and extracting only the pattern or removing the surface pattern and extracting only the unevenness information.
iCore's controllers are highly compatible with this multi-scanning imaging system and have an extensive product lineup.
CCS and iCore plan to globally and speedily provide high-value-added image inspection solutions that combine the strengths of both companies.
3. Fiscal Year Ending December 2023 Earnings Forecasts
3-1 Earnings forecast
| FY 12/22 | Ratio to sales | FY 12/23 Est. | Ratio to sales | YoY | Revised ratio | Rate of Progress |
Sales | 54,811 | 100.0% | 57,000 | 100.0% | +4.0% | -5.0% | 47.7% |
Operating Profit | 6,303 | 11.5% | 6,500 | 11.4% | +3.1% | -13.3% | 40.9% |
Ordinary Profit | 7,042 | 12.8% | 6,900 | 12.1% | -2.0% | -9.2% | 42.5% |
Net Profit | 4,752 | 8.7% | 5,000 | 8.8% | +5.2% | -5.7% | 39.7% |
*Unit: million yen
The earnings Forecast Revised Downward.
The full-year earnings forecast for the fiscal year ending December 2023 has been revised downwardly. This was due to the company receiving requests from customers to postpone the shipment of products because of the impact of limiting capital investment in the semiconductor industry in the FA segment and the MVL segment of the IA business and the postponement of large-scale projects in the U.S. despite the firm sales in Europe in the security segment of the SS business in the first half of the fiscal year. Sales are expected to rise 4.0% year on year to 57 billion yen, and operating profit is forecast to rise 3.1% year on year to 6.5 billion yen. Even after the revision, it is expected that sales and operating profit will increase for the third consecutive year. From the third quarter onward, the company predicts orders for highly profitable products to improve in both the IA and SS businesses. There is no change in the dividend forecast. The company plans to raise the dividend by 4 yen/share from the previous term to 40.00 yen/share. The expected dividend payout ratio is 28.4%.
| 2Q of FY 12/23 Est. | 2Q of FY 12/23 Act. | Difference from Forecast | FY 12/22 Est | FY 12/22 Revised Est | Revised Amount |
Sales | 29,200 | 27,197 | -2,003 | 60,000 | 57,000 | -3,000 |
Operating Profit | 3,600 | 2,659 | -941 | 7,500 | 6,500 | -1,000 |
Ordinary Profit | 3,650 | 2,931 | -719 | 7,600 | 6,900 | -700 |
Net Profit | 2,550 | 1,985 | -565 | 5,300 | 5,000 | -300 |
*Unit: million yen
The sales forecast for the second half has been revised downwardly by 1 billion yen. The profit forecast was revised downwardly by the amount not achieved in the first half.
◎Regional trends
| FY 12/22 | Ratio to sales | FY 12/23 Est. | Ratio to sales | YoY | Revision rate | Rate of Progress |
Consolidated sales | 54,811 | 100.0% | 57,000 | 100.0% | +4.0% | -5.0% | 47.7% |
Domestic | 24,549 | 44.8% | 24,921 | 43.7% | +1.5% | -5.9% | 47.4% |
International | 30,262 | 55.2% | 32,079 | 56.3% | +6.0% | -4.3% | 48.0% |
AMERICAs | 7,305 | 13.3% | 8,583 | 15.1% | +17.5% | -0.3% | 42.7% |
Europe | 15,316 | 27.9% | 15,985 | 28.0% | +4.4% | -2.5% | 52.2% |
Asia | 7,641 | 13.9% | 7,511 | 13.2% | -1.7% | -11.6% | 45.0% |
*Unit: million yen. Colored boxes for company-wide revenue growth rate of +4.0% or more, company-wide revision rate of -5.0% or less, and company-wide sales progress rate of 47.7% or more.
3-2 Trends in each segment
①Sales of each segment
| FY 12/22 | Ratio to sales | FY 12/23 Est. | Ratio to sales | YoY | Revision rate | Rate of Progress |
SS Business | 23,465 | 42.8% | 25,014 | 43.9% | +6.6% | -1.0% | 48.4% |
IA Business | 29,738 | 54.3% | 30,468 | 53.5% | +2.5% | -7.9% | 47.4% |
EMS Business | 1,006 | 1.8% | 939 | 1.6% | -6.7% | -9.4% | 38.7% |
Others | 600 | 1.1% | 579 | 1.0% | -3.5% | -6.9% | 49.7% |
Consolidated sales | 54,811 | 100.0% | 57,000 | 100.0% | +4.0% | -5.0% | 47.7% |
*Unit: million yen. Colored boxes for company-wide revenue growth rate of +4.0% or more, company-wide revision rate of -5.0% or less, and company-wide sales progress rate of 47.7% or more.
② Trends in each segment and region
| FY 12/22 | Ratio to sales | FY 12/23 Est. | Ratio to sales | YoY | Revision rate | Rate of Progress |
SS: Security | 16,067 | 100.0% | 17,313 | 100.0% | +7.8% | +1.1% | 48.5% |
Japan | 2,545 | 15.8% | 2,904 | 16.8% | +14.1% | +3.5% | 43.6% |
AMERICAs | 3,708 | 23.1% | 4,087 | 23.6% | +10.2% | +2.1% | 45.3% |
EMEA | 8,419 | 52.4% | 8,769 | 50.6% | +4.2% | +1.2% | 53.7% |
Asia, Oceania | 1,395 | 8.7% | 1,553 | 9.0% | +11.3% | -5.7% | 36.4% |
SS: Automatic door | 5,311 | 100.0% | 5,626 | 100.0% | +5.9% | -2.9% | 48.7% |
Japan | 2,405 | 45.3% | 2,485 | 44.2% | +3.3% | 0.0% | 50.0% |
AMERICAs | 1,624 | 30.6% | 1,764 | 31.4% | +8.6% | -2.1% | 48.3% |
EMEA | 1,112 | 20.9% | 1,215 | 21.6% | +9.3% | -8.6% | 47.6% |
Asia, Oceania | 170 | 3.2% | 162 | 2.9% | -4.7% | -9.5% | 42.0% |
|
|
|
|
|
|
|
|
IA:FA | 10,995 | 100.0% | 10,309 | 100.0% | -6.2% | -11.8% | 50.1% |
Japan | 4,543 | 49.2% | 4,364 | 49.7% | -3.9% | -11.2% | 45.9% |
AMERICAs | 201 | 25.9% | 227 | 25.2% | +12.9% | -5.0% | 45.4% |
EMEA | 2,960 | 21.9% | 2,854 | 21.8% | -3.6% | -7.7% | 56.6% |
Asia, Oceania | 3,291 | 2.9% | 2,864 | 3.2% | -13.0% | -16.9% | 50.4% |
IA:MVL | 13,311 | 100.0% | 13,882 | 100.0% | +4.3% | -4.0% | 48.4% |
Japan | 6,628 | 49.8% | 6,943 | 50.0% | +4.8% | -0.7% | 49.4% |
AMERICAs | 1,750 | 13.1% | 1,646 | 11.9% | -5.9% | -0.2% | 51.7% |
EMEA | 2,824 | 21.2% | 3,146 | 22.7% | +11.4% | -4.8% | 45.8% |
Asia, Oceania | 2,109 | 15.8% | 2,147 | 15.5% | +1.8% | -14.5% | 46.4% |
IA:IPC | 4,122 | 100.0% | 4,277 | 100.0% | +3.8% | -5.5% | 47.3% |
Japan | 4,101 | 99.5% | 4,272 | 99.9% | +4.2% | -5.5% | 47.3% |
AMERICAs | 21 | 0.5% | 5 | 0.1% | -76.2% | -16.7% | 80.0% |
IA:MECT | 1,311 | 100.0% | 2,000 | 100.0% | +52.6% | -17.0% | 27.1% |
Japan | 1,267 | 96.6% | 1,144 | 57.2% | -9.7% | -23.5% | 46.9% |
AMERICAs | 0 | 0.0% | 850 | 42.5% | - | -7.1% | 0.0% |
Asia, Oceania | 44 | 3.4% | 6 | 0.3% | -86.4% | - | 100.0% |
|
|
|
|
|
|
|
|
EMS | 1,006 | 100.0% | 939 | 100.0% | -6.7% | -9.4% | 38.7% |
Japan | 588 | 58.4% | 397 | 42.3% | -32.5% | -31.2% | 42.8% |
AMERICAs | 1 | 0.1% | 1 | 0.1% | 0.0% | - | 100.0% |
Asia, Oceania | 417 | 41.5% | 541 | 57.6% | +29.7% | +17.9% | 35.5% |
*Unit: million yen. Colored boxes for company-wide revenue growth rate of +4.0% or more, company-wide revision rate of -5.0% or less, and company-wide sales progress rate of 47.7% or more.
4.Growth Strategies Initiatives
Under the group's corporate philosophy of " We aim to become a corporate group full of Venture Spirit," the company aspires to achieve an operating profit of 10 billion yen or more and an operating profit margin of 14% in 2025 and has positioned "business model transformation" as the core of its growth strategy and is making a shift from conventional single-product sales to solution sales.
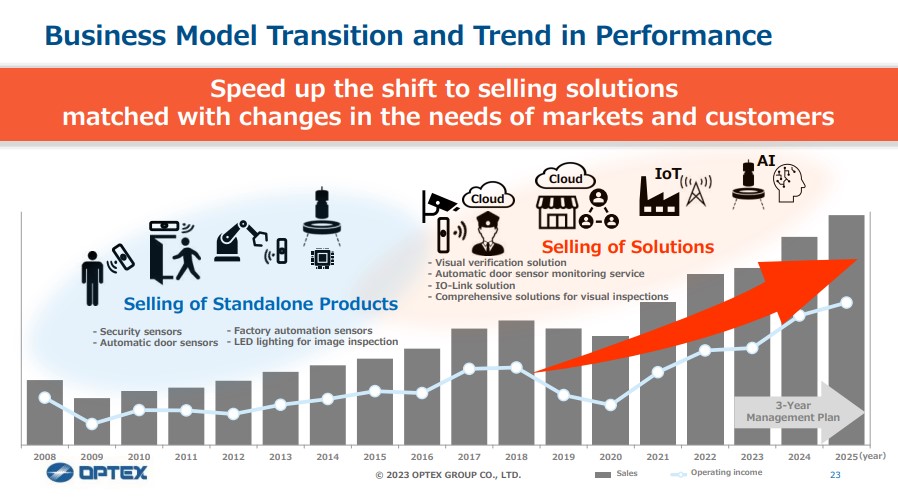
(From the company release)
(1) SS business: Expansion of direct marketing strategy
Until now, the company has sold products to infrastructure facilities through distributors, but due to the distance from customers and markets, it tended to be late in responding to changes in on-site needs.
Therefore, in order to accurately grasp customer and market needs, the company is increasing its share of direct marketing while using distributors. In addition to infrastructure facilities, the company has expanded its customer base to include system integrators and construction consultants and has proactively developed solution proposals.
This led to the development of new products, such as camera built-in laser scan sensors and shutter sensors, as well as the development of the data center market.
(2) IA business (FA segment): Advancement of the challenger strategy
As with the SS business, the company conducts direct consulting and marketing in order to grasp on-site needs and reflect them in product planning.
In addition to sales proposals and consulting by sales staff, planning and development staff visit customers to ascertain their needs, narrow down customers and applications, and provide accurate and impactful consulting services to customers.
Moreover, as a strategy for shifting from single-product sales to solution sales, the company is focusing on providing solutions centered on the "IO-Link master, " which is a communication technology that enables the two-way exchange of various data between sensors and higher-level control systems and is steadily building a track record.
(3) IA business (MVL segment): Evolving into a total solution vendor
CCS, which holds the largest global share in the LED lighting business for image processing, has procured, in addition to MV lighting, power supplies, cameras, lenses, etc., from cooperating manufacturers and provides them as a system that is developed in the testing rooms to meticulously meet customer needs.
In recent years, it has expanded its field to include AI and robots and has set up an AI lab and a robotics room in collaboration with external manufacturers and vendors with the aim of "evolving into a total solution vendor in the inspection process."
As part of its sales activities, it holds a private exhibition called "CCS Machine Vision Solution Expo" nationwide and proposes solutions to solve customers' problems, leading to the expansion of its customer base.
5.Conclusion
The full-year earnings forecast has been revised downwardly due to requests for postponing product shipments in the IA business (FA and MVL segments) and postponement of large-scale projects in the SS business (security segment). However, sales in the SS business (security segment) have been revised upwardly, albeit by a small amount. Thus, the focus of the full-year outlook will be the trend in the IA business (FA segment), where sales have decreased from the previous quarter for four consecutive quarters. In particular, sales in Japan hovered around 1 billion yen, while sales in Asia and Oceania, centered on China, were 683 million yen in the second quarter (April-June), which was only 70% of the 927 million yen in the second quarter (April-June) of the fiscal year ended December 2022, the company's peak. The company expects that the slowdown in capital investment for secondary batteries will continue for the rest of the year, but we would like to pay attention to capital investment trends in the third and fourth quarters.
<Reference 1: Three-Year Management Plan>
(1)Outline
Under the corporate group’s philosophy of “aiming to be a corporate group brimming with a venture spirit,” the company aims to achieve operating profit of 10 billion yen or higher and operating profit margin of 14% in the fiscal year ending December 2025.
In the fiscal year ended December 2022, both sales and operating profit exceeded the forecast thanks to the outcomes of the growth strategy.
Thus, in the fiscal year ending December 2023, the company will continue strengthening sales of highly profitable products and aim to expand operating profit. The company will also continue to develop each business further and accelerate the shift to the sale of solutions, aiming for sales of 74 billion yen and an operating profit of 10 billion yen in the fiscal year ending December 2025.
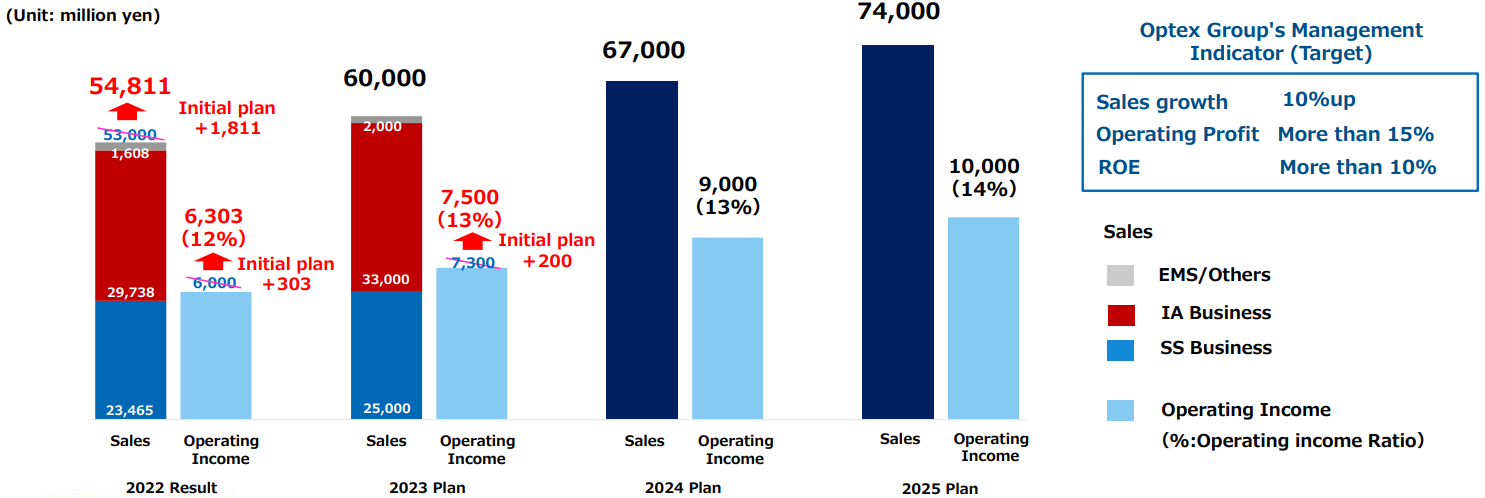
(From the company release)
(2) Strategy and Progress for target achievement
The three prongs of its strategy are “growth of existing businesses,” “growth of companies acquired,” and “synergy with companies acquired.”
The company is promoting these growth strategies to achieve the management plan.
① Growth of existing businesses: Provide system solutions
*SS Business: Security Sensor segment
<Results in the fiscal year ended December 2022>
The company started supplying new products to partners in Europe.
The number of companies newly adopting the system and registrations are increasing steadily in North America.
*SS Business: Automatic Door Sensor segment
<Results in the fiscal year ended December 2022>
The sales of automatic door remote monitoring services increased, contributing to an improvement in the rate of signing a maintenance contract.
The company promoted the diversification of OMNICITY (a service launched in February 2021) applications, such as using it at large commercial facilities, restaurants, and real estate.
*IA Business: FA segment
<Results in the fiscal year ended December 2022>
The company expanded the IO-Link lineup through aggressive development investment.
It released eight series of new products to meet customer needs.
*IA Business: Machine Vision Lighting (MVL) segment
<Results in the fiscal year ended December 2022>
The company held a large-scale private exhibition, Solution EXPO.
The company received many inquiries as it was highly evaluated for its ability to provide extensive proposals.
② Growth of companies acquired: Main businesses of companies acquired through M&As expand with favorable conditions in the market environment
*IA Business: Sanritz Automation
<Results in the fiscal year ended December 2022>
The sales of industrial PCs increased due to the expansion of semiconductor facility investment.
The company is promoting the development of a system to expand business areas that are less susceptible to external environmental risks.
*IA Business: Mitsutec
<Results in the fiscal year ended December 2022>
With the expansion of investment in secondary battery manufacturing equipment for EVs, the company acquired a large-scale project that will continue to be shipped from the fiscal year 2023 onward.
③ Synergy with companies acquired
*Sanritz Automation and Optex: SS business
<Results in the fiscal year ended December 2022>
The two companies will promote adopting remote monitoring camera systems for important domestic facilities.
In the fiscal year ended December 2022, the two companies started the joint development of a remote image monitoring system with an automatic tracking function that utilizes AI.
*Mitsutec and Optex FA:FA segment
<Results in the fiscal year ended December 2022>
As comprehensive solution vendors, the two companies will promote selling services in the IA business.
In the fiscal year ended December 2022, the two companies started collaborating on a visual inspection solution that utilizes robots.
The two companies are also collaborating to strengthen the capability of proposing products and expand technical support.
<Reference 2: Regarding Corporate Governance>
◎Organization type, and the composition of directors and auditors
Organization type | Company with audit and supervisory committee |
Directors | 9directors, including 4 outside ones |
◎Corporate Governance ReportThe latest revision date: March 24, 2023
<Fundamental concept>
As the Group, we recognize that it is our greatest mission to continuously improve corporate value while earning the trust of our shareholders, investors, customers, and society. To practice it, we consider enhancement of the corporate governance as one of important management tasks and aim to improve the transparency of management, maintain management systems accompanying fair and prompt decision making and strengthen management monitoring function.
<Disclosures Based on the Principles in the Corporate Governance Code (Excerpt)>
[Principle 1-4. Cross-shareholdings]
The Company acquires and possesses cross-shareholdings upon deliberations and a resolution by the Board of Directors only when it is determined that it will contribute to strengthening business relationships and increasing corporate value in the Group’s business strategy. In addition, the Board of Directors verifies the significance of the shares we held every year. If it determines that the reasonable value sought is poor, we will strive to sell and reduce that holding in consideration of market trends and other factors.
Cross-shareholdings held by the Company at present: 52 million yen in one company (Amount on the balance sheet for December 31, 2022)
The Company makes a comprehensive judgement to determine the advisability of exercising the voting rights for the shares we hold. We individually examine this based on whether doing so will contribute to the sustainable growth and improvement of mid- to long-term corporate value improvement of that company and whether doing so will significantly harm shareholder value.
[Supplementary Principle 2-4-1. Ensuring Diversity in the Promotion of Core Personnel]
The concept of our corporate group since the business start-up has been "a desire to be a company in which self-actualization is possible for employees with the company serving as the stage for that." Under this desire, we have focused on creating an environment so that employees themselves can make the stages of their lives full of changes and inspiration without discriminating between men and women, nationalities, and between new employees fresh out of college and mid-career hires.
The status of employees of our domestic group companies (12 companies including our company) is as follows.
- Male / female rati Male: Female = 78%: 22%
- Ratio of mid-career hires: 61%
- Ratio of foreign employees: 1%
- Male-female ratio of managers: Male: Female = 97%: 3%
- Ratio of mid-career hires among managers: 69%
As mentioned above, due to the characteristics of the Group's business areas and business content, there are potentially few female and foreign employees, and their percentage among managers is not high at present.
On the other hand, more than 60% of mid-career hires have been promoted to managerial positions showing that we recognize that diverse human resources with various experiences and skills shall occupy the core of management.
In addition, our corporate group has consolidated subsidiaries worldwide. Thus, we believe that we have sufficiently ensured the diversity of our corporate group as a whole, including these subsidiaries.
We will consider the features of each operating company in each business area and continue to actively promote and review the environment to fully demonstrate the capabilities of each employee to secure more diversity of employees.
[Supplementary Principle 3-1-3. Sustainability Initiatives]
Lessening environmental burdens → https://www.optexgroup.co.jp/en/esg/environment-impact.html
The ESG Report is available at → https://www.optexgroup.co.jp/shareholder/library/index.html#esgreport
We expressed our support for TCFD in January this year and set the goal for CO2 reduction of the corporate group as “30% until 2030 (compared to 2019: Scopes 1 and 2).” We will keep focusing on the improvement of the quality and quantity of information disclosure concerning our corporate group’s initiatives for sustainability.
[Principle 5-1. Policy on Constructive Dialogue with Shareholders]
The Company has established an public relations・IR Department. The IR Department strives to provide easy-to-understand explanations about our management policies and business conditions to engage in positive and constructive dialogue with our shareholders. In addition, the President, the responsible officer, and IR personnel give briefings for institutional investors and briefings for private investors on a planned basis. We respond to requests for meetings with institutional investors as the occasion calls.
We establish a venue to allow the attendance of diverse shareholders at our ordinary general meeting of shareholders. We then hold a shareholder briefing to obtain understanding for our future policies after the end of that meeting.
This report is not intended for soliciting or promoting investment activities or offering any advice on investment or the like, but for providing information only. The information included in this report was taken from sources considered reliable by our company. Our company will not guarantee the accuracy, integrity, or appropriateness of information or opinions in this report. Our company will not assume any responsibility for expenses, damages or the like arising out of the use of this report or information obtained from this report. All kinds of rights related to this report belong to Investment Bridge Co., Ltd. The contents, etc. of this report may be revised without notice. Please make an investment decision on your own judgment. Copyright(C) Investment Bridge Co., Ltd. All Rights Reserved. |