Bridge Report:(2593)ITO EN Fiscal Year April 2019
![]()
ITO EN, LTD. (Common stock: 2593, Preferred stock: 25935)
|
 |
Company Information
Exchange | TSE 1st Section |
Industry | Food products (manufacturing) |
President | Daisuke Honjo |
Address | 47-10, Honmachi 3-chome, Shibuya-ku, Tokyo |
Year-end | April |
URL |
Stock Information
<Common Stock>
Share Price | Number of shares issued (excluding treasury shares) | Total market cap | ROE (Actual) | Trading Unit | |
¥5,140 | 88,555,644 shares | ¥455,176 million | 9.9% | 100 shares | |
DPS (Forecast) | Dividend yield (Actual) | EPS (Actual) | PER (Actual) | BPS (Actual) | PBR (Actual) |
¥40.00 | 0.8% | ¥114.21 | 45.0 times | ¥1,229.28 | 4.2 times |
* The share price is the closing price on June 24.
<Preferred Stock>
Share Price | Number of shares issued (excluding treasury shares) | Total market cap | ROE (Actual) | Trading Unit | |
¥2,446 | 34,057,131 shares | ¥83,304 million | 9.9% | 100 shares | |
DPS (Forecast) | Dividend yield (Actual) | EPS (Actual) | PER (Actual) | BPS (Actual) | PBR (Actual) |
¥50.00 | 2.0% | ¥124.16 | 19.7 times | ¥1,234.28 | 2.0 times |
* The share price is the closing price on June 24.
Consolidated Earnings Trends
Fiscal Year | Net Sales | Operating Income | Ordinary Income | Net Income | EPS (Common stock) | DPS (Common stock) |
April 2016 (Actual) | 465,579 | 17,243 | 15,074 | 8,615 | 67.37 | 40.00 |
April 2017 (Actual) | 475,866 | 21,774 | 21,524 | 13,693 | 108.77 | 40.00 |
April 2018 (Actual) | 494,793 | 22,043 | 21,441 | 12,553 | 99.79 | 40.00 |
April 2019 (Actual) | 504,153 | 22,819 | 23,211 | 14,462 | 116.02 | 40.00 |
April 2020 (Forecast) | 510,000 | 23,000 | 22,800 | 14,200 | 120.00 | 40.00 |
* The forecasted values were provided by the company.
* Unit: Million yen or yen
Table of Contents
Key Points
1. Company Overview
2. The Fiscal Year Ended April 2019 Earnings Results
3. The Fiscal Year Ending April 2020 Financial Estimates
4. Brand Strategies
5. Conclusions
Reference: Regarding Corporate Governance
Key points
- In the term ended April 2019, sales and operating income increased by 1.9% and 3.5%, respectively, year on year. Sales of ITO EN (non-consolidated) rose 2.9% year on year mainly with “Oi Ocha” and “Kenko Mineral Mugicha (healthy mineral Barley Tea).” Regarding profit, the effort at thorough sales activities with weight attached to profitability improved profitability to the end of the term. The company plans to pay a term-end dividend of 20 yen/share for Common Stocks (which will result in an annual dividend of 40 yen/share together with the dividend paid in the first half of the term) and 25 yen/share for Preferred Stocks (which will be an annual dividend of 50 yen/share together with the dividend paid in the first half of the term).
- For the term ending April 2020, sales and operating income are projected to increase 1.2% and 0.8%, respectively, year on year. The company forecasts that the tea beverage market will grow by 2.2% year on year to 966 billion yen, expecting a 1.5% year-on-year rise in sales by ITO EN (non-consolidated). The earnings forecast submitted by the company is conservative for all of the products in general, with the sales growth for “Oi Ocha” and Kenko Mineral Mugicha estimated at 2.8% and 2.5%, respectively. Increases in the price of the ingredients and materials, and soaring advertising cost due in part to the campaign celebrating the 30th anniversary of “Oi Ocha” will be offset by profit.
- In addition to the early end of the rainy season and record scorching heat last year, the impact of the consumption tax increase scheduled for October is unclear; therefore, the earnings forecasts for fiscal year 2020 are conservative. As seen in the business performance in the second half of the term ended April 2019, however, the company is successfully enhancing profitability by putting importance on profitability without losing its market share. We would like to pay attention to how much ITO EN, LTD. will be able to generate revenue aside from the conservatively estimated earnings.
1. Company Overview
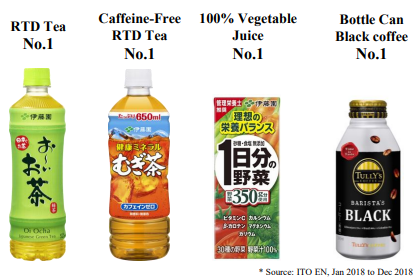
ITO EN mainly manufactures and sells beverages (including green tea, coffee, and vegetable juice), and tea leaves, and also operates restaurants and conducts franchise (FC) business of Tully’s Coffee, etc., manufactures and sells supplements via its subsidiaries. In Japan, the company has the largest share of 33% (as of Dec. 2017) in the market of green tea beverages, including “Oi Ocha.” In addition, it owns a variety of popular product brands, such as “Kenko Mineral Mugicha” (healthy mineral barley tea) which is the bestselling caffeine-free tea beverage, “Ichinichibun no Yasai” (One Day Veggie), the most selling 100% vegetable beverage, and “TULLY’S COFFEE” which is the top-selling bottle-shaped canned black coffee product developed in cooperation with Tully’s Coffee Japan Co., Ltd.. Each of them has achieved an annual sales quantity of over 10 million cases (“Oi Ocha” has sold more than 80 million cases).
The ITO EN Group is composed of 31 consolidated subsidiaries, including Tully’s Coffee Japan Co., Ltd. and Chichiyasu Company, and 3 companies accounted for using the equity method.
With the aim of becoming a “Global Tea Company,” it is developing the ITO EN brand and cultivating new green tea markets in the U.S. (mainly New York), Australia, China, and Southeast Asia.
1-1. Management Principle “Always Putting the Customer First”
(Taken from the reference material of the company)
1-2.Five Concepts for Product Development since the Establishment of the Company
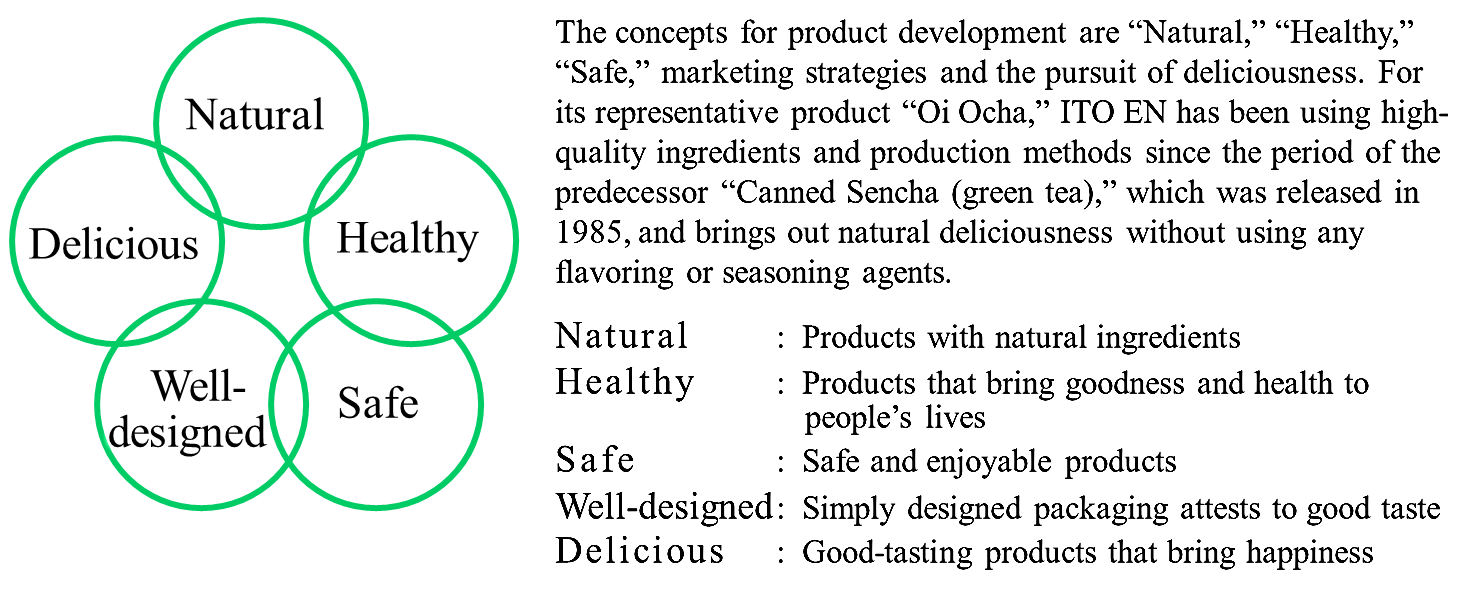 |
(Taken from the reference material of the company)
1-3.Outline of the business
The business of ITO EN is classified into the Tea Leaves and Beverages Business, which manufactures and sells tea leaves and beverages, the Restaurant Business, in which Tully’s Coffee Japan Co., Ltd. operates specialty coffee shops and FC business, and The Others, in which Mason Distributors, Inc. (Florida, the U.S.) manufactures and sells supplements.
For the term ended Apr. 2019, the sales of ITO EN (non-consolidated) accounted for 85.2% of the Tea Leaves and Beverages Business (78.2% of consolidated sales). As for the composition of the sales(non-consolidated), tea leaves make up 9.4%, beverages 89.7%, and others 0.9%.
Sales and profit of each segment for the term ended Apr. 2019
| Sales | Composition ratio | YoY | Operating income | Composition ratio | YoY |
Tea Leaves and Beverages Business (A) | 462,841 | 91.8% | +1.6% | 19,806 | 4.3% | +3.4% |
Restaurant Business | 34,555 | 6.9% | +6.1% | 3,504 | 10.1% | +7.8% |
Others | 6,756 | 1.3% | +2.1% | 771 | 11.4% | -17.9% |
Adjustment | - | - | - | -1,263 | - | - |
Total (Consolidated sales/operating income) | 504,153 | 100.0% | +1.9% | 22,819 | 4.5% | +3.5% |
ITO EN (non-consolidated):B (composition rati B/A) | 394,495 | 78.2% | +2.9% | 15,851 | 4.0% | +3.0% |
* Unit: Million yen
Product brands representative of ITO EN, LTD. that have sold over 10 million cases annually
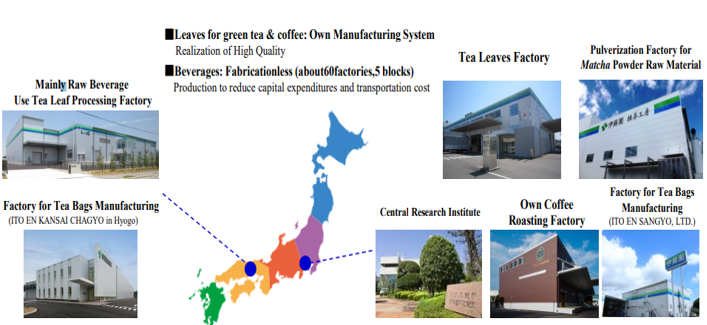
1-4.Production Structure
Operating 5 factories: Shizuoka Sagara Factory to which the Central Research Institute is attached, Hamaoka Factory (both of which are located in Shizuoka Prefecture), Kobe Factory (Hyogo Prefecture), Fukushima Factory (Fukuoka Prefecture), and Okinawa Nago Factory (Okinawa Prefecture), the company produces the ingredients of most of the leaf products, and the beverage products. It outsources the operations of filling up containers for the drink products and producing part of the leaf products to factories outside of the group companies because ITO EN, LTD. keeps in mind reduction of capital investment risks and swift response to the changing market environment (while the company is in charge of planning and development, development of production methods, and quality control, including sanitary management at the subcontract factories and environmental conservation).
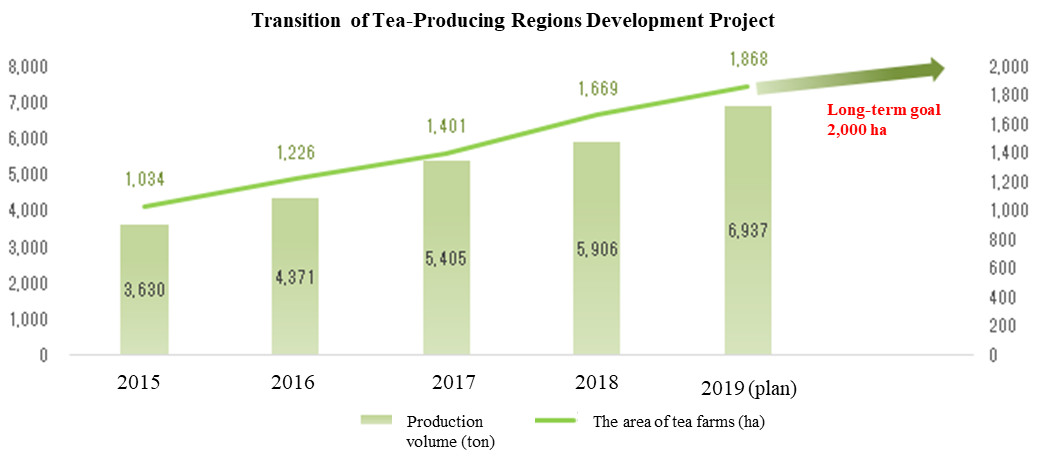
1-5.Toward a sustainable growth model – Tea-Producing Regions Development Project
In Japan, agricultural farmers are aging and the number of working farmers is shrinking due to the lack of successors, causing the area of tea farms to decline while deserted plant cultivation land is expanding. Furthermore, 30% of the tea trees in tea farms are getting old at the age of over 30 years. Thus, the company engages in the Tea-Producing Regions Development Project with the aim of contributing to the local community by utilizing such abandoned cultivation land, nurturing successors to tea farmers, and creating employment, and of stably procuring higher quality tea ingredients.
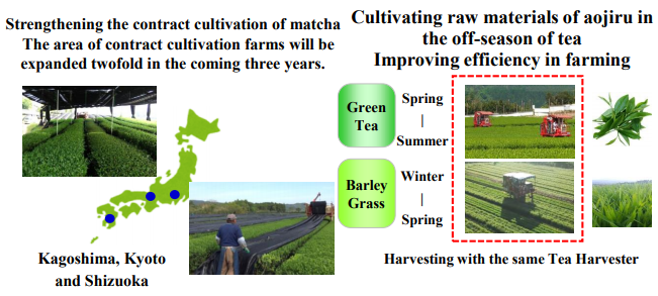
The Tea-Producing Regions Development Project is composed of the two pillars: the “contract cultivation with tea farmers” and the “large-scale new tea farm business” that nurtures farmers who produce tea leaves by redeveloping deserted cultivation land into tea farms. The company has continued the “contract cultivation with tea farmers” since the 1970s, through which it enters into a contract with tea farmers that allows it to buy all the tea leaves from the farmers and its Agricultural Technical Department gives instructions to the contracted farmers, ranging from how to select saplings to how to develop tea farms and how to cultivate tea leaves at low cost through automation and introduction of IT. Meanwhile, the large-scale new tea farm business was started in 2001 in order to utilize abandoned cultivation land and nurture farmers who will newly begin tea leaf cultivation. It is cities, towns, villages, and local businesses that play a central role in establishing tea farms and producing tea leaves while the company comprehensively provides them with techniques and knowhow as it does in the “contract cultivation with tea farmers” and purchases all the tea leaves produced by them. As the Kyushu region is replete with flat ground that is suited to large-scale cultivation with machines, some farmers in the area are said to work for one third or less of the working hours of the farmers in Shizuoka Prefecture.
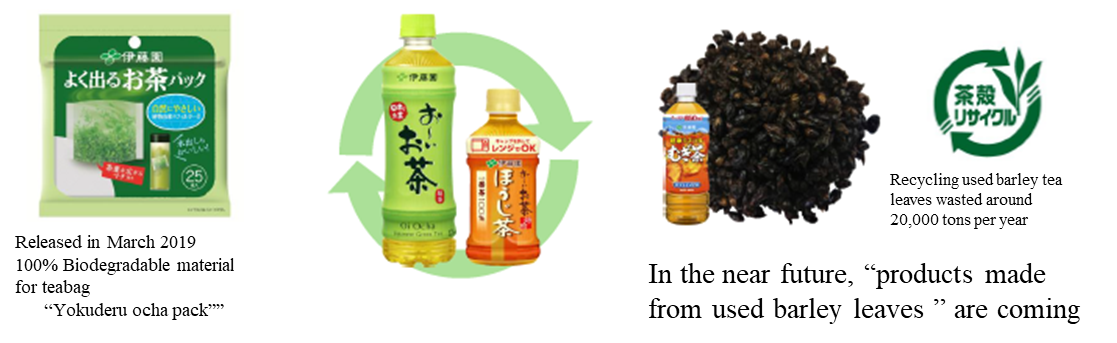
1-6.Efforts at environmental conservation
Developed a plant-based filter, which will be applied to tea bags | Developed a recycled plastic bottle that uses 100% reprocessed resin | Established a Used Barley Tea Leaves Recycle System for storing them at the room temperature while they are still wet and using them in transportation and industrial products |
| ||
 | ||
2. The Fiscal Year Ended April 2019 Earnings Results
2-1.Market trend
Tea beverage market hit a record high thanks in part to the record intense heat in the summer
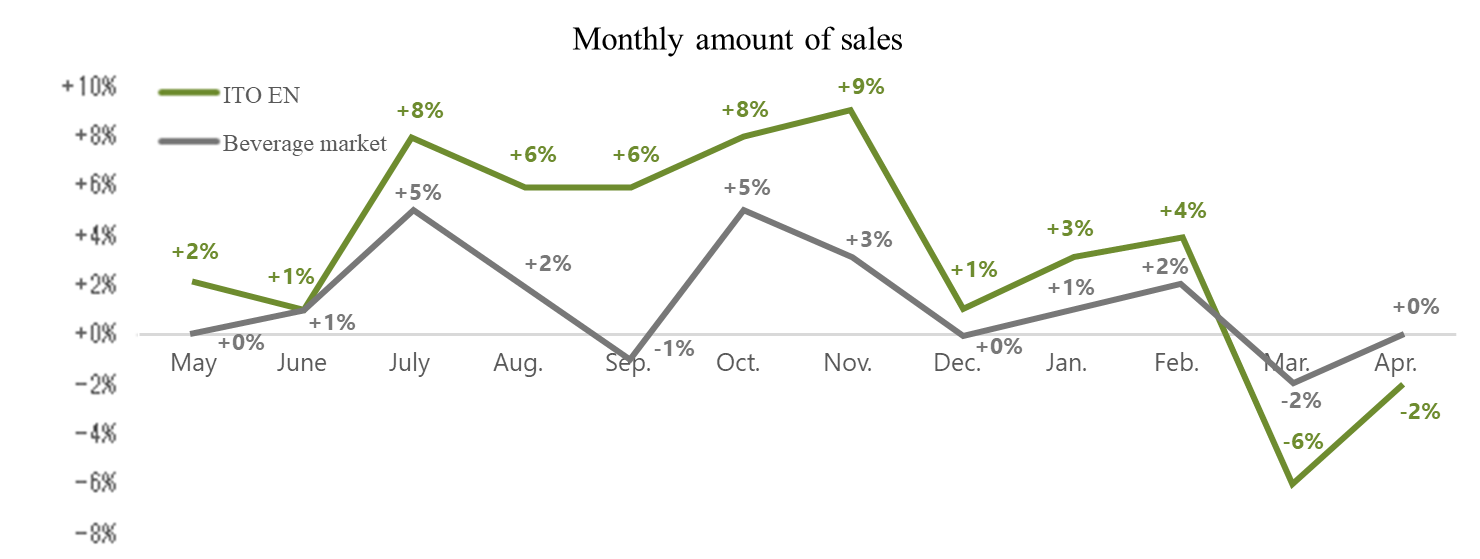
In 2018, the tea beverage market grew 0.6% year on year to 945 billion yen, which hit a record high, thanks in part to the Barley Tea drinks that showed a sales increase of 14.5% year on year while sales from green tea beverages rose 1.1% year on year. Although the natural disasters generated confusion in production and logistics, the volume of shipment also marked a record high because of the escalating demand for stockpiles in preparation for disaster as well as the impact or the record scorching heat in the summer. The business results of 2018 are characterized by the surging demand for drinks in mall-sized plastic bottles that can easily be carried and for Barley Tea and Hojicha (roasted green tea) which had been considered to be thirst-quenching drinks in summer. In addition, a number of beverage manufacturers announced that they would raise the price of their large-sized drink products on the back of rises in freight cost attributed to labor shortages.
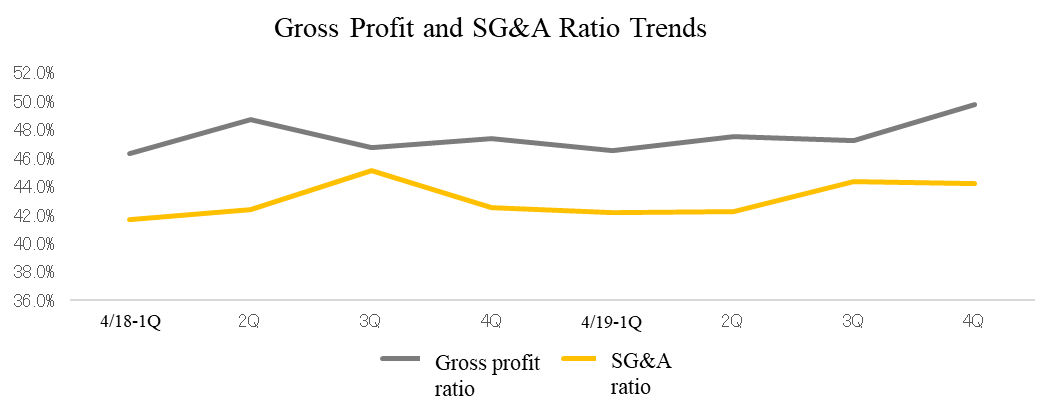
The total amount of products sold exceeded the growth of the beverage market in general although the company experienced a business opportunity loss due to the confusion in the supply chain in Western Japan in the summer that was caused by the natural disasters; however, in March and April, as a result of the effort to instill the sales approach focusing on profitability, which was made in the second half of the term, the total amount sold fell short of the growth of the market. The company-wide effort to boost profitability by shifting the focus of the evaluation system from sales to profit in the second half of the term bore fruit in the form of improved gross profit and selling, general and administrative (SG&A) ratio as illustrated in the graph below.
2-2.Consolidated earnings
| FY 4/18 | Ratio to sales | FY 4/19 | Ratio to sales | YOY | 2Q Forecast | Difference from the estimate |
Sales | 494,793 | 100.0% | 504,153 | 100.0% | +1.9% | 507,800 | -0.7% |
Gross Profit | 233,983 | 47.3% | 240,375 | 47.7% | +2.7% | 240,220 | +0.1% |
SG&A expenses | 211,939 | 42.8% | 217,555 | 43.2% | +2.6% | 217,220 | +0.2% |
Operating Income | 22,043 | 4.5% | 22,819 | 4.5% | +3.5% | 23,000 | -0.8% |
Ordinary Income | 21,441 | 4.3% | 23,211 | 4.6% | +8.3% | 22,500 | +3.2% |
Profit attributable to onwers of parent | 12,553 | 2.5% | 14,462 | 2.9% | +15.2% | 14,000 | +3.3% |
*unit: million yen
Sales and operating income increased 1.9% and 3.5%, respectively, year on year.
Sales stood at 504,150 million yen, up 1.9% year on year. By group company, sales by ITO EN (non-consolidated) grew 2.9% year on year to 394,490 million yen, with sales by Tully’s Coffee and Other Overseas Subsidiaries, the majority of which is accounted for by China, rising by 6.1% and 10.0%, respectively, year on year. On the other hand, the US Business showed a 7.8% year-on-year sales decrease owing to the changes in commercial distribution.
The breakdown of the sales rise at ITO EN (non-consolidated) are as follows: sales from drinks increased 2.9% year on year while those from tea leaves went up 3.6% year on year. Sales from other products, such as aojiru powder, shrank 1.5% year on year. Regarding the beverage products, amid a 6.6% year-on-year growth in Japanese Tea and Healthy Tea thanks mainly to “Oi Ocha” (up 2.1% year on year) and “Kenko Mineral Mugicha” (up 15.6% year on year), sales from “Hojicha Latte” (one of the TEAs’ TEA brand products) that is made from Hojicha (roasted green tea) and milk grew 29% year on year, resulting in a 12.6% year-on-year sales increase of the Black Tea product. Functional beverages, such as “Ringo Su” (apple cider vinegar) and “Kurozu de Kassei” (activation with black vinegar), also increased 15.3% year on year. On the other hand, sales from vegetable beverages, which the entire industry struggled with, dropped 3.4% year on year (demand for vegetable beverages tend to decrease when the market prices of fresh vegetables and fruits are affordable).
Operating income grew 3.5% year on year to 22,810 million yen. Gross profit margin improved 0.4 points to 47.7% because the marketing efforts that focused on profitability bore fruit by the end of the term. The company successfully curbed an increase in SG&A expenses, which went up just by 2.6% throughout the year, with the approaches that it had taken since the second half of the term (they rose 4.1% from the same period of the year earlier in the first half). Ordinary income went up 8.3% year on year because the foreign exchange gain of 280 million yen (which was a loss of 340 million yen in the previous term) improved non-operating profit or loss. Although the company recorded an extraordinary loss of 1,450 million yen due in part to loss on disposal of obsolete inventories in the US Subsidiaries, corporate taxes and other expenses declined (from 8,340 million yen to 7,750 million yen), resulting in a net income of 14,460 million yen that grew 15.2% year on year.
Major Components of SG&A
| FY 4/18 | Ratio to sales | FY 4/19 | Ratio to sales | YOY | 2Q Forecast | Difference from the estimate |
Selling commission | 81,615 | 16.5% | 84,760 | 16.8% | +3.9% | 84,876 | -0.1% |
Advertising cost | 12,491 | 2.5% | 11,544 | 2.3% | -7.6% | 11,590 | -0.4% |
Freight cost | 14,188 | 2.9% | 15,210 | 3.0% | +7.2% | 14,965 | +1.6% |
Depreciation and amortization | 10,873 | 2.2% | 11,296 | 2.2% | +3.9% | 11,384 | -0.8% |
Others | 92,772 | 18.7% | 94,745 | 18.8% | +2.1% | 94,405 | +0.4% |
total | 211,939 | 42.8% | 217,555 | 43.2% | +2.6% | 217,220 | +0.2% |
*unit: million yen
Sales in each company
| FY 4/18 | Ratio to sales | FY 4/19 | Ratio to sales | YOY | 2Q Forecast | Difference from the estimate |
ITO EN (Non-consolidated) | 383,212 | 72.5% | 394,495 | 73.0% | +2.9% | 394,300 | +0.0% |
Tully`s Coffee Japan Co., Ltd. | 32,589 | 6.2% | 34,568 | 6.4% | +6.1% | 34,300 | +0.8% |
Chichiyasu Company | 14,398 | 2.7% | 14,409 | 2.7% | +0.1% | 15,100 | -4.6% |
Other Domestic Subsidiaries | 57,737 | 10.9% | 58,789 | 10.9% | +1.8% | 58,842 | -0.1% |
US Business (unit: thousand dollars) | 35,130 | 6.6% | 32,385 | 6.0% | -7.8% | 34,044 | -4.9% |
Other Overseas Subsidiaries | 5,231 | 1.0% | 5,783 | 1.1% | +10.6% | 5,521 | +4.7% |
Elimination of Internal Transactions | -33,504 | - | -36,276 | - | - | -34,308 | - |
Consolidated Sales | 494,793 | - | 504,153 | - | +1.9% | 507,800 | -0.7% |
*unit: million yen
Operating profit in each company
| FY 4/18 | Ratio to sales | FY 4/19 | Ratio to sales | YOY | 2Q Forecast | Difference from the estimate |
ITO EN (Non-consolidated) | 15,394 | 4.0% | 15,851 | 4.0% | +2.9% | 16,500 | -3.9% |
Tully`s Coffee Japan Co., Ltd. | 3,250 | 10.0% | 3,504 | 10.1% | +7.8% | 3,270 | +7.2% |
Chichiyasu Company | 305 | 2.1% | 269 | 1.9% | -11.8% | 370 | -27.3% |
Other Domestic Subsidiaries | 2,068 | 3.6% | 2,029 | 3.5% | -1.9% | 1,789 | +13.4% |
US Business (unit: thousand dollars) | 2,018 | 5.7% | 1,658 | 5.1% | -17.8% | 2,015 | -17.7% |
Other Overseas Subsidiaries | 600 | 11.5% | 1,080 | 18.7% | +79.8% | 1,081 | -0.1% |
Elimination of Internal Transactions | -1,592 | - | -1,572 | - | - | -2,025 | - |
Consolidated Sales | 22,043 | 4.5% | 22,819 | 4.5% | +3.5% | 23,000 | -0.8% |
*unit: million yen
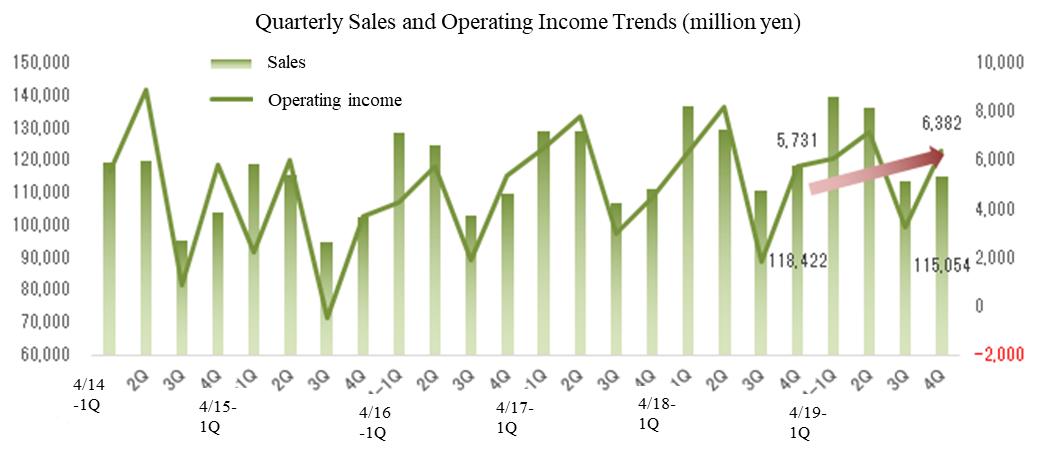
Quarterly performance
| 4/18-1Q | 2Q | 3Q | 4Q | 4/19-1Q | 2Q | 3Q | 4Q |
Sales | 136,451 | 129,432 | 110,488 | 118,422 | 139,568 | 135,900 | 113,631 | 115,054 |
Gross Profit | 63,232 | 63,006 | 51,647 | 56,098 | 64,963 | 64,548 | 53,638 | 57,226 |
SG&A expenses | 56,909 | 54,833 | 49,830 | 50,367 | 58,895 | 57,404 | 50,413 | 50,843 |
Operating Income | 6,323 | 8,173 | 1,816 | 5,731 | 6,068 | 7,144 | 3,225 | 6,382 |
Gross profit margin | 46.3% | 48.7% | 46.7% | 47.4% | 46.5% | 47.5% | 47.2% | 49.7% |
Sales expense ratio | 41.7% | 42.4% | 45.1% | 42.5% | 42.2% | 42.2% | 44.4% | 44.2% |
*unit: million yen
2-3.Profitability improvement management
The company has established a competitive edge in the value chain from Procurement to Manufacturing and Logistics, Sales, and Product Planning and Development. In the Procurement phase, it is forging ahead with the Tea-Producing Regions Development Project in cooperation with large-scale agricultural production corporations primarily in the Kyushu region with the aim of stably procuring ingredients and boosting the quality of tea leaves. Playing a part in social contributions, such as creation of employment, regional revitalization, and environmental conservation, this project provides local farmers with stable and sustainable opportunities for operating farms, improves productivity, and contributes to curtailing working hours by helping the farmers introduce machines and IT on a broad scale.
At the stage of Manufacturing and Logistics, the company has developed environmentally friendly plastic bottles by reconsidering the raw and other materials of plastic bottles. It plans to adopt the newly developed bottle to “Oi Ocha” and “Barley Tea” in the term ending March 2020. Furthermore, it strived to cut down on costs throughout Japan at the 60 factories to which it has entrusted production of beverages and the 19 logistics centers operated by the joint venture set up by logistics companies.
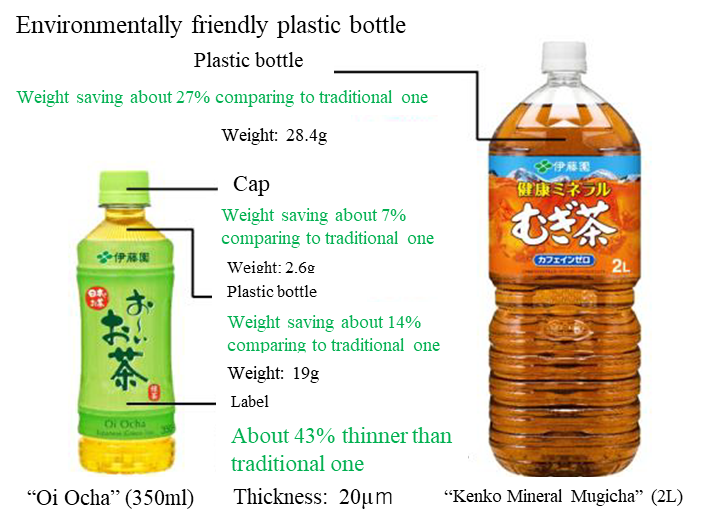
(Taken from the reference material of the company)
In the Sales phase, the company engages in community-based sales activities through information collection and feedback to customers at the 196 sales bases operated nationwide. In addition, it has propelled forward activities to enlighten the tea culture by the staff who have passed the “Tea Taster” Business Skill Test approved by the Ministry of Health, Labour and Welfare, and efforts to lead the activities to sales. Furthermore, although the company evaluated its sales employees based mainly on their sales performance, it shifted the evaluation system to the one that attaches weight to profit in the second half of the term ended April 2019, which made business results evident toward the end of the term.
In the phase of Product Planning and Development, the company succeeded in prospecting for new markets with the aojiru juice product that are sold over the counter (in cartons, reclaimed polyethylene terephthalate (PRET), and bottles), on which the company has a virtual monopoly, and sugar-free lattes, and is endeavoring to strengthen the lineup of products to sell via vending machines in cooperation with one of its subsidiaries, NEOS Co., Ltd. In addition, it has developed Field Chip “Greentea” that utilizes used tea leaves in collaboration with MIZUNO Corporation (securities code: 8022). Field Chip “Greentea” can be used as filler for artificial turf and holds down the rise of the ground temperature by about 7°C compared to the conventional fillers.
2-4.Financial Status and Cash Flows (CF)
| April 2018 | April 2019 |
| April 2018 | April 2019 |
Cash and deposits | 61,664 | 63,738 | Trade payables | 29,879 | 30,181 |
Trade receivables | 58,083 | 56,581 | Accrued expenses | 25,896 | 24,839 |
Inventories | 38,708 | 43,588 | Interest-bearing debts | 57,942 | 56,542 |
Total current assets | 170,838 | 177,449 | Lease obligations | 17,284 | 12,501 |
Property, plant and equipment | 84,822 | 84,186 | Net defined benefit liability | 9,922 | 10,313 |
Intangible fixed assets | 21,588 | 18,956 | Total liabilities | 157,416 | 153,058 |
Investments and other assets | 23,918 | 23,389 | Total net assets | 143,750 | 150,923 |
Total fixed assets | 130,329 | 126,532 | Total liabilities and net assets | 301,167 | 303,981 |
*unit: million yen
Total assets at the end of the term stood at 303,980 million yen, up 2,810 million yen from the end of the previous term. Cash and deposit, and total net assets increased on the back of stable Cash Flows and healthy business performance, and the business expansion raised trade receivables and trade payables. Meanwhile, depreciation of goodwill and software resulted in a reduction in intangible fixed assets, and lease assets and obligations decreased as well. Capital-to-asset ratio was 49.2% (which was 47.3% at the end of the previous term).
Cash Flows (CF)
| FY 4/18 | FY 4/19 | YoY | |
Operating CF (A) | 25,322 | 26,128 | +806 | +3.2% |
Investing CF (B) | -11,359 | -10,635 | +724 | - |
Free CF (A+B) | 13,963 | 15,493 | +1,530 | +11.0% |
Financing CF | -16,639 | -15,005 | +1,634 | - |
Balance of cash and cash equivalents at end of period | 61,376 | 61,950 | +574 | +0.9% |
*unit: million yen
Operating CF was 26,120 million yen, which was almost at the same level as that of the previous term with income before tax being 22,480 million yen, depreciation expenses standing at 13,410 million yen, and the amount paid as corporate taxes and other expenses being 7,120 million yen. Investing CF increased because mainly of the acquisition of tangible and intangible fixed assets at 10,630 million yen, and the continued deficit of financing CF was attributed to the expenditure of 6,510 million yen due to payment of finance lease obligations and dividend distribution of 5.2 billion yen.
Reference : Transition of ROE
| FY 4/15 | FY 4/16 | FY 4/17 | FY 4/18 | FY 4/19 |
ROE | 5.91% | 6.81% | 10.46% | 9.03% | 9.90% |
Net income | 1.69% | 1.85% | 2.88% | 2.54% | 2.87% |
Total assets turnover | 1.58times | 1.62times | 1.61times | 1.64times | 1.67times |
Leverage | 2.21times | 2.27times | 2.25times | 2.17times | 2.07times |
*ROE = Net income × Total assets turnover × leverage. Net income, and total assets turnover are from interim period.
Aiming at more than 10 % of ROE, it struggles to improve profitability, total assets turn over, and, EPS, and stable DPS.
3. The Fiscal Year Ending April 2020 Financial Estimates
| FY 4/19 Results | Ratio to sales | FY 4/20 Forecast | Ratio to sales | YOY |
Sales | 504,153 | 100.0% | 510,000 | 100.0% | +1.2% |
Gross profit | 240,375 | 47.7% | 243,649 | 47.8% | +1.4% |
SG&A expenses | 217,555 | 43.2% | 220,648 | 43.3% | +1.4% |
Operating income | 22,819 | 4.5% | 23,000 | 4.5% | +0.8% |
Ordinary income | 23,211 | 4.6% | 22,800 | 4.5% | -1.8% |
Net income | 14,462 | 2.9% | 14,200 | 2.8% | -1.8% |
*unit: million yen
Sales and operating income are estimated to grow 1.2% and 0.8%, respectively, year on year.
Sales are projected to stand at 510 billion yen, up 1.2% year on year, with the tea beverage market expected to grow 2.2% year on year to 966 billion yen. Sales by ITO EN (non-consolidated) are estimated at 400.5 billion yen, up 1.5% year on year. The earnings forecast is conservative for the products in general on the premise that “Oi Ocha” will show a year-on-year sales rise of 2.8% and sales from Kenko Mineral Mugicha will increase 2.5% year on year; however, sales from the over-the-counter aojiru juice product (in cartons and plastic bottles) is expected to rise greatly by 18.8% year on year.
The company projects that operating income will increase 0.8% year on year to 23 billion yen. It is anticipated that gross profit margin will improve by 0.1 points with the price increases of raw and other materials being offset by growing sales of the mainstay products and adoption of environmentally friendly plastic bottles. Advertising cost will rise owing to the campaign honoring the 30th anniversary of “Oi Ocha” while growth of other expenses will be held down, allowing SG&A expenses to increase just by 1.4% year on year.
Major Components of SG&A
| FY 4/19 Results | Ratio to sales | FY 4/20 Forecasts | Ratio to sales | YOY |
Selling commission | 84,760 | 16.8% | 85,540 | 16.8% | +0.9% |
Advertising cost | 11,544 | 2.3% | 12,774 | 2.5% | +10.7% |
Freight cost | 15,210 | 3.0% | 15,490 | 3.0% | +1.8% |
Depreciation and amortization | 11,296 | 2.2% | 11,096 | 2.2% | -1.8% |
Others | 94,745 | 18.8% | 95,748 | 18.8% | +1.1% |
Total | 217,555 | 43.2% | 220,648 | 43.4% | +1.4% |
*unit: million yen
Performance in each company
| FY 4/19 Results | Composition ratio | FY 4/20 Forecast | Composition ratio | YoY |
ITO EN (Non-consolidated) | 394,495 | 73.0% | 400,500 | 72.8% | +1.5% |
Tully`s Coffee Japan Co., Ltd. | 34,568 | 6.4% | 36,300 | 6.6% | +5.0% |
Chichiyasu Company | 14,409 | 2.7% | 14,580 | 2.7% | +1.2% |
Other Domestic Subsidiaries | 58,789 | 10.9% | 59,169 | 10.8% | +0.6% |
US Business (unit: thousand dollars) | 32,385 | 6.0% | 33,350 | 6.1% | +3.0% |
Other Overseas Subsidiaries | 5,783 | 1.1% | 5,902 | 1.1% | +2.1% |
Elimination of Internal Transactions | -36,276 | - | -39,801 | - | - |
Consolidated Sales | 504,153 | - | 510,000 | - | +1.2% |
ITO EN (Non-consolidated) | 15,851 | 4.0% | 16,200 | 4.0% | +2.2% |
Tully`s Coffee Japan Co., Ltd. | 3,504 | 10.1% | 3,510 | 9.7% | +0.1% |
Chichiyasu Company | 269 | 1.9% | 350 | 2.4% | +29.9% |
Other Domestic Subsidiaries | 2,029 | 3.5% | 1,583 | 2.7% | -22.0% |
US Business (unit: thousand dollars) | 1,658 | 5.1% | 1,710 | 5.1% | +3.1% |
Other Overseas Subsidiaries | 1,080 | 18.7% | 1,034 | 17.5% | -4.2% |
Elimination of Internal Transactions | -1,572 | - | -1,387 | - | - |
Consolidated Operating Income (Profit Ratio) | 22,819 | 4.5% | 23,000 | 4.5% | +0.8% |
average to the US dollar in the term | ¥111.27 |
| ¥108.00 |
|
|
*unit: million yen
4. Brand strategies
| FY 4/18 | Ratio to sales | FY 4/19 | Ratio to sales | YOY | FY 4/20 Forecast | Ratio to sales | YOY |
Tea leaves | 35,700 | 9.3% | 36,969 | 9.4% | +3.6% | 38,466 | 9.6% | +4.1% |
Beverages | 343,853 | 89.6% | 353,921 | 89.7% | +2.9% | 358,329 | 89.5% | +1.2% |
Others | 3,659 | 1.0% | 3,605 | 0.9% | -1.5% | 3,703 | 0.9% | +2.7% |
Sales | 383,212 | 100.0% | 394,495 | 100.0% | +2.9% | 400,500 | 100.0% | +1.5% |
Japanese Tea/Healthy Tea | 186,579 | 48.7% | 198,815 | 50.3% | +6.6% | 202,887 | 50.6% | +2.0% |
Chinese Tea | 17,421 | 4.5% | 16,782 | 4.3% | -3.7% | 16,416 | 4.1% | -2.2% |
Vegetable | 47,154 | 12.3% | 45,531 | 11.5% | -3.4% | 46,355 | 11.6% | +1.8% |
Fruit | 11,866 | 3.1% | 10,451 | 2.6% | -11.9% | 10,304 | 2.6% | -1.4% |
Coffee | 42,758 | 11.2% | 41,758 | 10.6% | -2.3% | 42,647 | 10.6% | +2.1% |
Black tea | 5,083 | 1.3% | 5,723 | 1.5% | +12.6% | 5,034 | 1.3% | -12.0% |
Functional | 6,821 | 1.8% | 7,863 | 2.0% | +15.3% | 8,416 | 2.1% | +7.0% |
Mineral water | 10,462 | 2.7% | 11,040 | 2.8% | +5.5% | 9,824 | 2.5% | -11.0% |
Carbonated | 11,936 | 3.1% | 11,911 | 3.0% | -0.2% | 12,242 | 3.1% | +2.8% |
Others | 3,768 | 1.0% | 4,041 | 1.1% | +7.2% | 4,199 | 1.0% | +3.9% |
Total sales of beverages | 343,853 | 89.6% | 353,921 | 89.7% | +2.9% | 358,329 | 89.5% | +1.2% |
*unit: million yen
4-1.Oi Ocha (beverage)
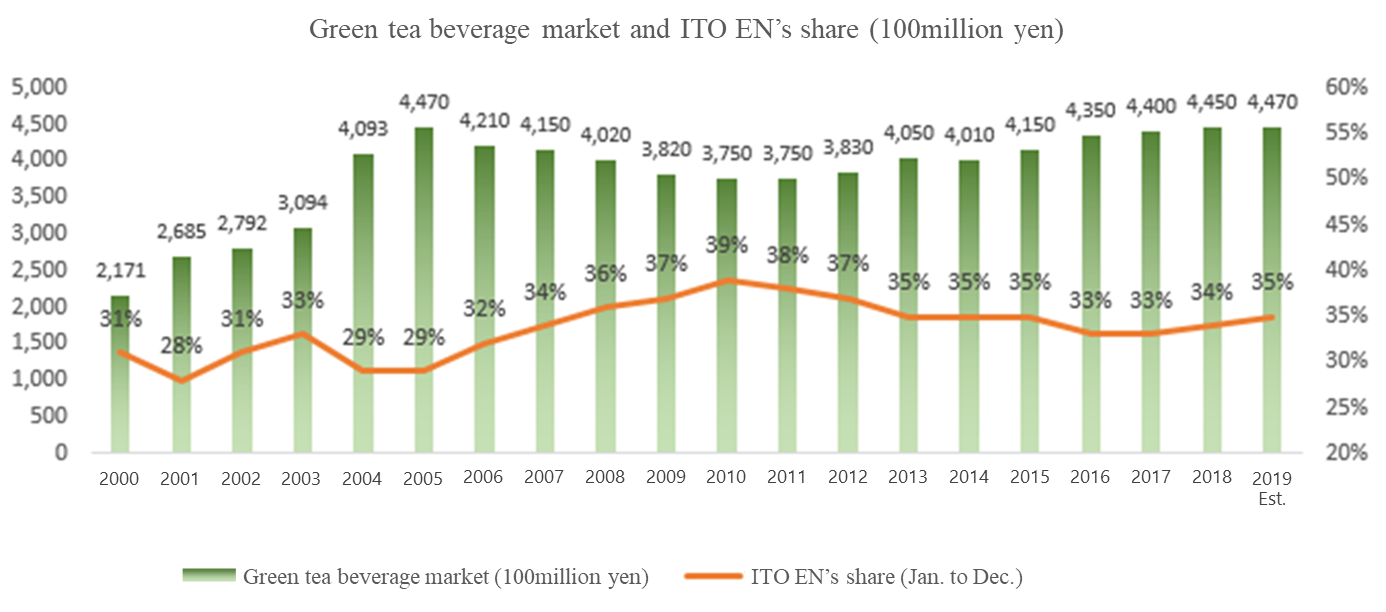
The company forecasts that the green tea market will be 447 billion yen (up 0.4% year on year) in 2019, which is almost at the same level as the market scale in 2005 that hit a record high, and plans to raise its market share by 1 point to 35%.
“Oi Ocha,” which was released in 1989, will mark the 30th anniversary this year. Releasing the world’s first bottled green tea in 1990, the company has sold about 31,840 million bottles in cumulative total for 30 years in the Heisei era. “Oi Ocha” is the “best-selling bottled beverage in the Heisei era” (according to the Nikkei POS) in the green tea beverage category. ITO EN has not only made tea a “more familiar beverage” but also created and developed the sugar-free beverage market for 30 years in the Heisei era.
Aiming to take a market share of 45% and sell 100 million cases annually
In an effort to raise the market share by 10 points, the company is striving to attract new fans. As part of this approach, it started selling “Oi Ocha Shinryoku” targeting women in their 10s to 30s in the term ended April 2019 (in May 2018). “Oi Ocha Shinryoku” received the gold award in the Drink Section of “FOODEX Bisyoku Joshi (female epicures)” Award 2019 (on March 5, 2019), a big food event that selects food and drink items which women are happy to buy and eat. The company sold over two million cases of the product in the term ended April 2019. Having sold 90,180 thousand cases of the products under the “Oi Ocha” brand in the term ended March 2019, the company aims to sell more than 100 million cases as early as possible (only the “Minami Alps no Tennensui (natural water from the South Alps)” and “Georgia” brands have sold over 100 million cases in Japan).
Making tea a more familiar item
On May 23, 2019, the “Oi Ocha” brand (excluding the Hojicha (roasted green tea) product) was listed in Guinness World Records as the “Largest NH RTD green tea product – retail RSP, current” (for the year of 2018). Furthermore, “Oi Ocha Koicha” has been approved for a label as “Foods with Function Claims” as an item that reduces body fat, and the company plans to release the redesigned version as a Food with Function Claims this fall. The amount of the healthy catechins contained in “Oi Ocha Koicha” is two times as much as that in the other green tea products of the company. It has sold more than 3.5 billion bottles in cumulative total, and will strengthen sales activities for the product as a Food with Function Claim. In addition, sales from “Oi Ocha Ryokucha,” which the company began to sell in May of this year in a new, thinner, and smaller container (more environmentally friendly plastic bottle) than the conventional ones, have been steady. Although the product has not been available broadly nationwide yet, its high turnover ratio seems to allow the company to build up confidence.
Other than the aforementioned efforts, the company has hosted “Dai-Cha-Kai (demonstration sales and training events of green tea)” through which it sells its products by offering tea samples and entertains guests with tea at various areas all across Japan as activities to pass down and create the tea culture. In addition, it has been treating with tea foreign tourists visiting Japan at Sensoji Temple (Taito Ward, Tokyo) and people from overseas nations at the embassies of various countries.
4-2.Tea leaves
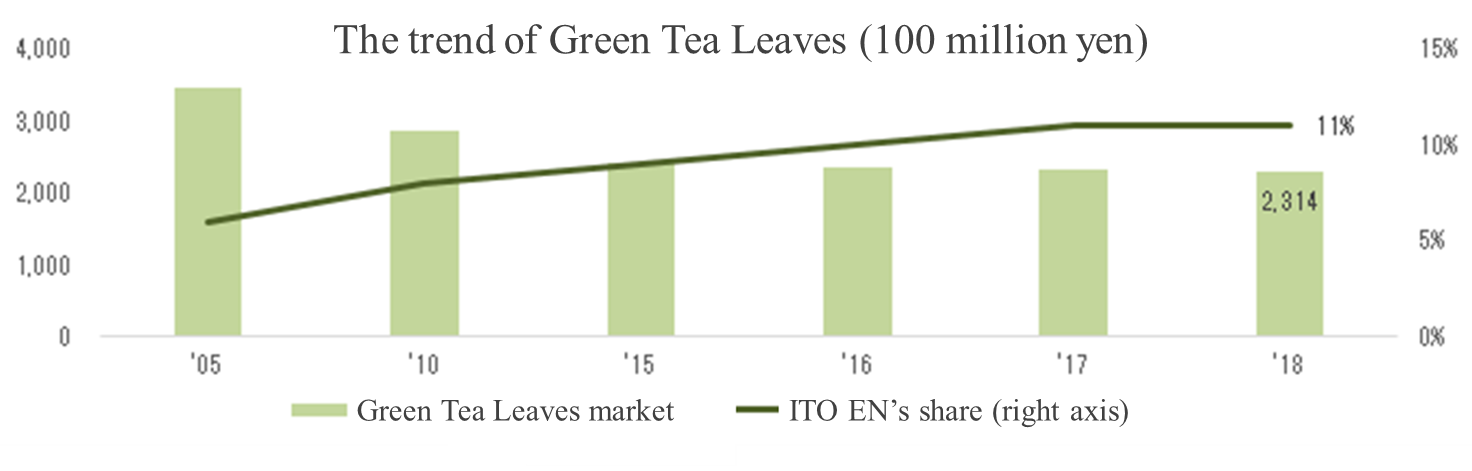
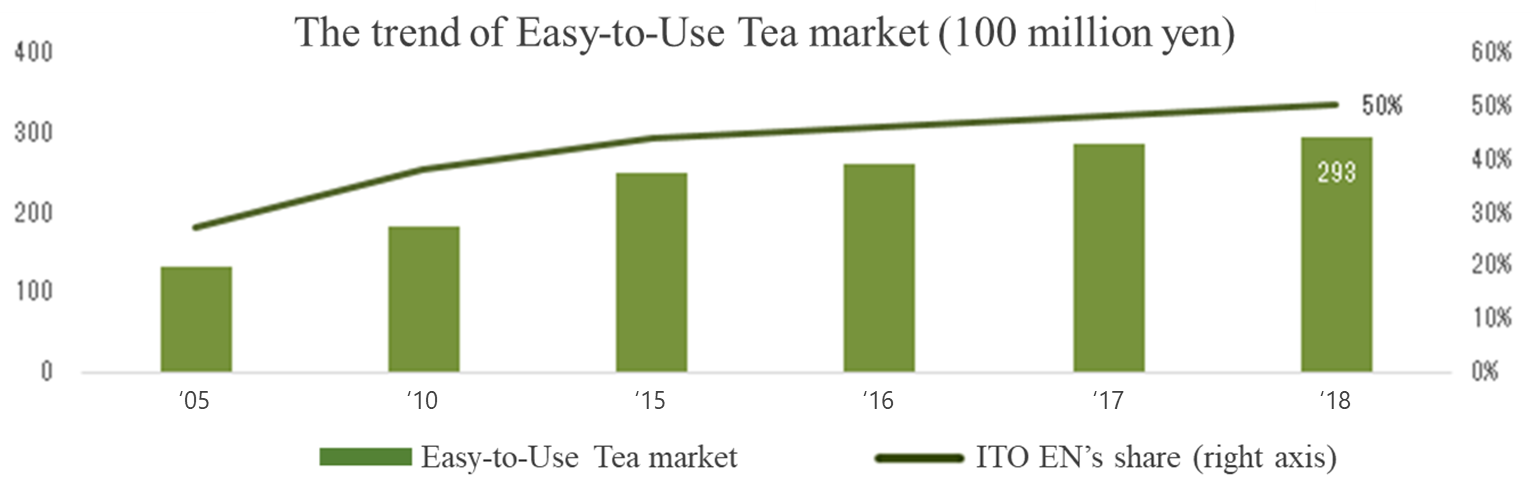
According to the reference material produced by the company, demand for green tea leaves (including Packaged Tea Leaf, Unpackaged Tea Leaf, and Easy-to-Use Tea) is shrinking, causing the market to go down by two thirds from 348.2 billion yen in 2005 to 231.4 billion yen in 2018; however, the market only for the Packaged Tea Leaf and Unpackaged ones shows a reduction in the scale, and the Easy-to-Use product market is growing, including tea bags and instant tea products, which the company has been focusing on and taken the lion’s share (50%). Although the burden of capital investment in tea bag and instant tea products is heavy, the company continuously makes capital investment every term at its factories and the factory of one of its subsidiaries in Shizuoka Prefecture.
Advantages of ITO EN’s Matcha
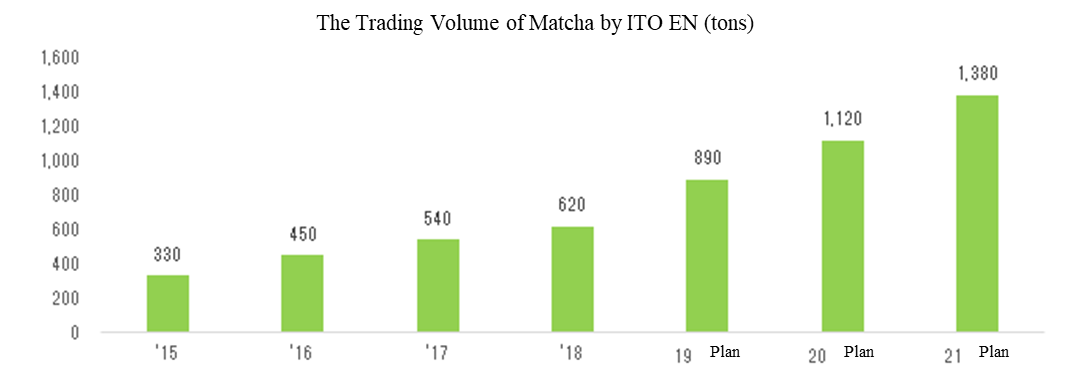
Not only does the company engage in contract cultivation with farmers of Matcha (Tencha sweet tea), but it also develops production technology for various purposes and applications and makes sales activities by bringing forward proposal to food manufacturers and other related companies. The trading volume of Matcha, which is rising each year, is projected to jump by 43.5% year on year to 890 tons in 2019 (the term ending April 2020) and the company is expected to take a market share of 14%. The company plans to almost double the trading volume of Matcha in the next three years by raising sales from Matcha both in Japan and abroad. It is endeavoring to prospect for supply destinations, including food manufacturers. Although Matcha will lose its vivid green color when heated, the company has adopted a new production technology that it has successfully developed to prevent the discoloration.
4-3.Barley Tea and Vegetable Beverages
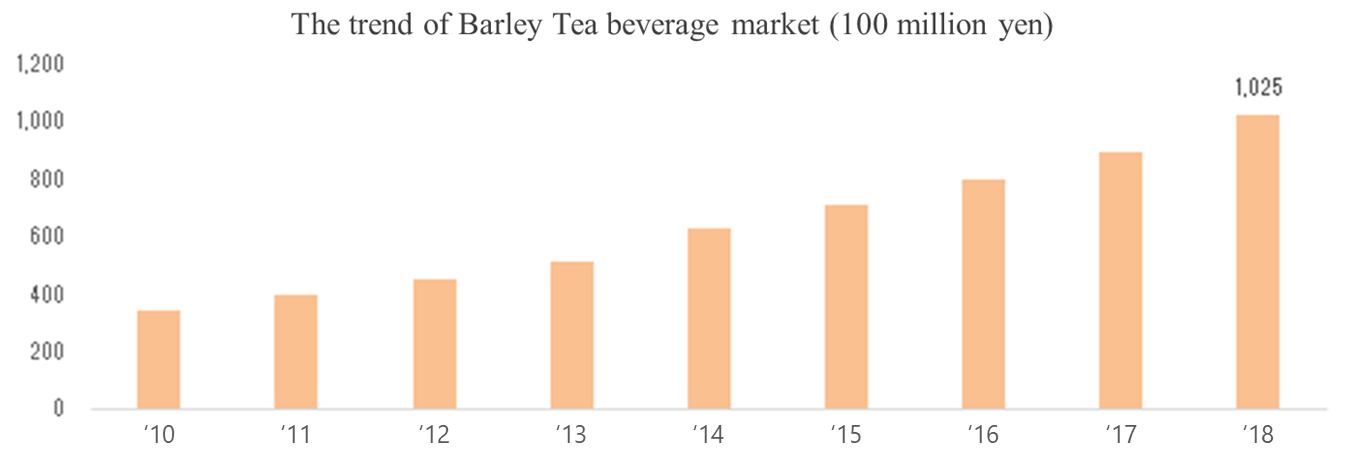
Barley Tea for which the company has a market share of over 40% for both drink and tea leaf products
The Barley Tea drink market continues to boom, and “Kenko Mineral Mugicha” sold 38 million cases in the term ended April 2019 with the company taking a market share of 42 – 44% (while the company’s share of Barley Tea leaves was 44%). The company has taken the largest share not only in the Barley Tea market but in the non-caffeinated tea beverage market as well.
Steady sales from plastic-bottled aojiru juice product
As described earlier, as for Vegetable Beverages, while sales from “Ichinichibun no Yasai (A daily worth of vegetables)” and “Jujitsu Yasai (mixed fruit and vegetable beverage)” were stagnant, those from aojiru juice has been going up on a continuous basis.
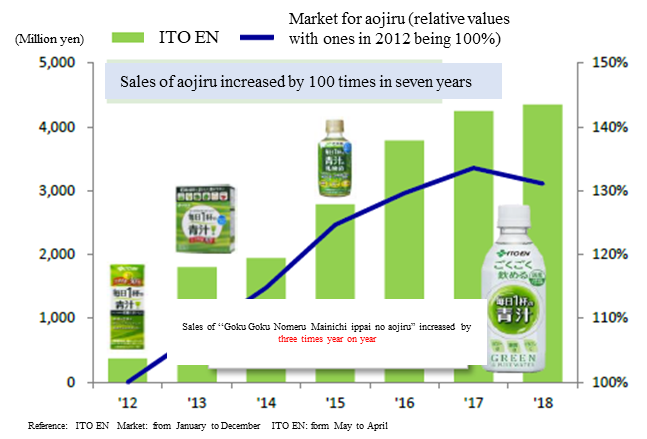
Demand for the aojiru product is shifting from powder to beverage. The ages of aojiru juice users is expanding from the conventional middle- and old-aged people to younger generations, increasing the number of applications. The company prospected for a market by starting off with sugared products (aojiru juice sweetened with soy milk) sold in cartons, and then began to sell sugar-free aojiru juice. Currently, sales from the sugar-free aojiru juice product sold in plastic bottles are soaring. The product lineup has been made diverse according to consumer needs, such as containers and taste. The company has only a competitor in the aojiru juice market and thus has been taking the lion’s share.
4-4.TULLY’S COFFEE
Bottle-shaped cans and plastic bottles
One of the leading beverage manufacturers released a 500-milliliter plastic-bottled coffee, which has taken the place of the bottle-shaped canned coffee, and it became a hit two years ago. Other manufacturers followed suit, allowing the plastic-bottled coffee of the same size to enter the mainstream temporarily. This transient demand affected TULLY’S COFFEE’s bottle-shaped canned coffee (350 milliliters) in the term ended April 2019, and sales from coffee products in general dropped by 2.3% year on year. The company plans to differentiate its products by improving its bottle-shaped canned black coffee, which is one of the company’s strengths, while enriching lineups of plastic bottled and other coffee products. Specifically, it will enhance the TULLY’S brand with the bottle-shaped canned black coffee that is characterized by the authentic quality targeting loyal customers, 500-milliliter plastic-bottled sugar-free latte designed for the young generation, and shot canned coffee “BARISTA’S DEMITASSE” and 275-milliliter plastic-bottled coffee for sale through vending machines.
At the present moment, the effort of improving ingredients and taste has become apparent in sales from bottle-shaped canned black coffee, which has seemingly enabled the company to have its own way with the turnover ratio that is 1.5 times greater than that of the bottle-shaped canned coffee product of the other two major beverage manufacturers. In the term ending April 2020, sales from the coffee products in general are expected to increase by 2.1% year on year.
Tully’s Coffee Japan Co., Ltd.,
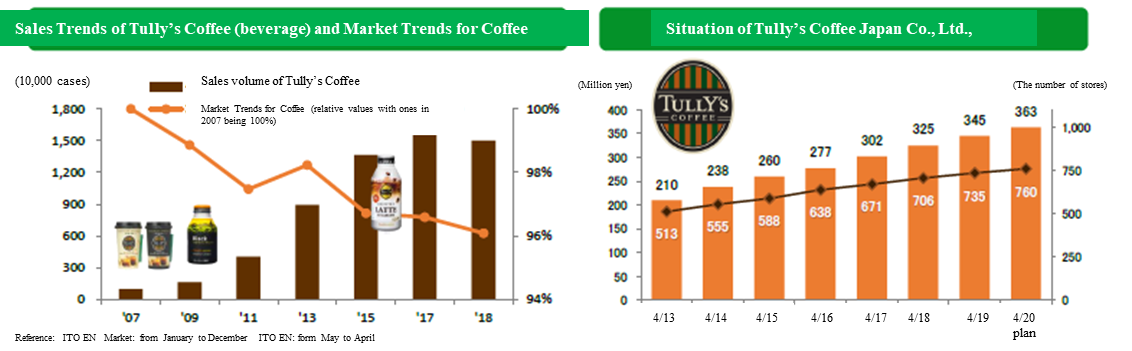
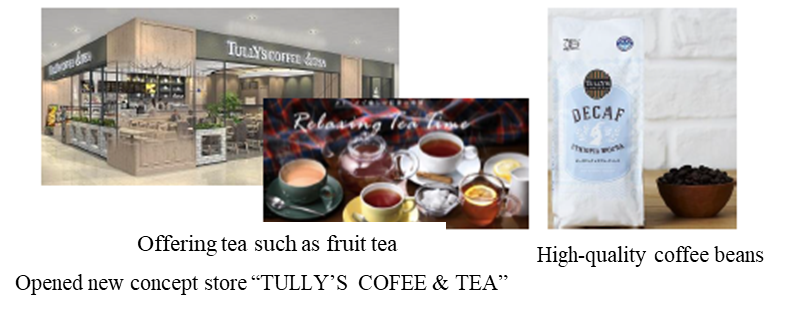
Meanwhile, one of the subsidiaries, Tully’s Coffee Japan Co., Ltd., is growing in business performance on a steady basis, with the number of stores standing at 735 at the end of the previous term. This term, the company expects a net increase in the number of shops by 25. The number of shops of Tully’s Coffee Japan Co., Ltd. is in the fourth place following Starbucks Corporation, Nippon Restaurant Enterprise Co., Ltd., and KOMEDA Holdings Co., Ltd., and the company will continue the effort to expand its store network. In addition, endeavoring to differentiate itself from the competitors, the company started to open “TULLY’S COFEE & TEA” where customers can enjoy not only coffee but also black tea and fresh juice. It has opened 4 TULLY’S COFEE & TEA stores as of June 5 and scheduled to open the 5th shop in the largest shopping center in Okinawa by the end of June. The company strives to build up a wider store network while differentiating itself by using carefully selected high-quality coffee beans only.
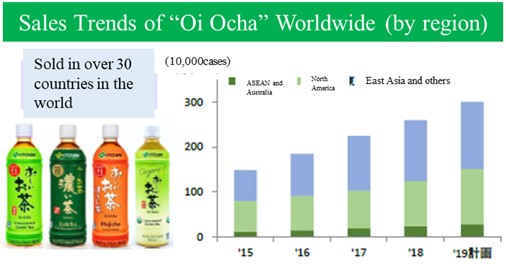
4-5.Global strategy
ITO EN will sell “Oi Ocha” and “MATCHA GREEN TEA” in North America, China, the Asian and Oceanian regions, the Middle East, and even the European Union that has imposed the strictest regulations. In the term ending April 2020, all of the items under the “Oi Ocha” brand, which will be sold in Australia, will use tea leaves cultivated only in Australia, and in the next term, a tea bag production factory is scheduled to be in operation.
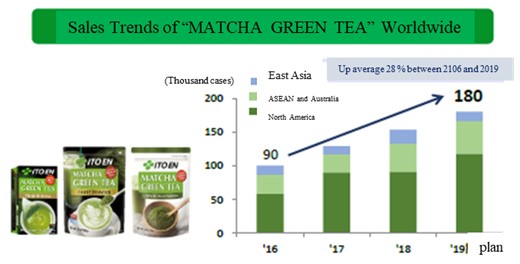
Sales from “MATCHA GREEN TEA” are rising chiefly in North America. The trading volume of Matcha in fiscal year 2018 was 620 tons, of which 170 tons were for overseas nations as broken down into 100 tons for North America and 70 tons for other countries. The quantity of “MATCHA GREEN TEA” sold in fiscal year 2019 is estimated at 180,000 cases, and the average growth rate since fiscal 2016 will reach 28%.
5. Conclusion
The earnings forecasts for the term ending April 2020 are conservative because of the unclear impact of the consumption tax increase scheduled for October, in addition to the early end of the rainy season and the scorching heat last year; however, the company shifted its business approach to the one that focuses on profitability in the second half of the previous term, which has changed its way of marketing the mainstay products that sell in large amounts, and thus, it is successfully boosting profitability without losing its market share. We would like to pay attention to how much the company can generate revenue aside from the conservatively estimated earnings.
In 2018, sugar-free beverages accounted for 49% of the domestic beverage market. They only made up 8% in the first year of the Heisei era 30 years ago but grew rapidly on the back of the increasing public awareness of “health.” Meanwhile, the sugar-free drink product of the company, which has taken the lead in the sugar-free beverage market with “Oi Ocha,” accounts for 74%. It is difficult to develop taste for sugar-free beverages because manufacturers cannot cover up the taste with sweetness or sourness. ITO EN, as a health creation company, has made efforts day and night with a focus on establishing the quality and taste of sugar-free beverages. Therefore, it is “confident in the techniques and attitude for producing sugar-free beverages that are incomparable to those of any other manufacturers” (according to President Honjo). Furthermore, in the “ITO EN Health Forum” held at Shibuya Hikarie (Shibuya Ward, Tokyo) on May 23, the company led a panel discussion under such subjects as “Wisdom of living 100 years of life with tea,” in addition to keynote lecturers about, for example, “Why are tea ceremony teachers youthful?”, in which about 400 people participated. The company also makes other efforts, including activities of educating people about “vegetables” through harvest festivals and proposal of recipes using vegetable beverages, in order to support healthy lifestyles. In addition, it proposes installing the Wellness Vending Machine that has an appealing power for value of health. The Wellness Vending Machine can sell beverages in three types of containers, including tea beverages in plastic bottles, sugar-free coffee in bottle-shaped cans, and aojiru juice, apple cider vinegar, and black vinegar in cartons, in the machine, which enhances the appeal of the value of health. A growing number of companies install the vending machine in their offices as part of their welfare programs.
Through efforts toward a “Global Tea Company,” ITO EN will make contributions to society and the environment with its Tea-Producing Regions Development Project and the used tea leaves recycle program, strive to pass down and create the tea culture, and contribute to healthy lifestyle by serving as a health creation company.
Reference: Regarding Corporate Governance
◎Organization type and the composition of directors and auditors
Organization type | Company with an audit and supervisory board |
Directors | 11 directors, including 2 outside ones |
Auditors | 4 auditors, including 3 outside ones |
◎Corporate Governance Report : Updated Dec 3, 2018
Basic Policy
“Always Putting the Customer First” is the ITO EN Group’s management philosophy. In the ITO EN Group’s Basic Policies, the basis of our business administration to take corporate social responsibility in cooperation with interested parties such as the government, local communities, consumers, shareholders, clients, suppliers, and financial institutions, in order to achieve sustainable growth and development as well as increasing our corporate value. This management philosophy is the fundamental policy behind our group’s corporate ethics and the unchanging truth that supports our corporate governance. Based on this philosophy, all the executives and employees of our group will actively pursue an operation that works towards a sustainable society while responding to the trust of all the interested parties. To realize an appropriate form of corporate governance, our company, which has a board of auditors, carries out audits in which the auditors inquire the business conditions, the decision-making processes, etc. of the representative directors, the directors in charge or the employees of our group companies. The auditors attend every meeting of the board of directors in order to give their objective and impartial opinions on the audit situations concerning the company in general or individual issues, and audit the business execution by the directors in accordance with the audit policies set out by the board of auditors.
<Reasons for Non-compliance with the Principles of the Corporate Governance Code (Excerpts)>
【Supplementary Principle 4-11 (1) Policies for the balance, diversity, and scale of the Board of Directors】
The number of members of the Board of Directors of our company is up to the limit specified by our articles of incorporation. As for its composition, the Board of Directors is basically composed of the necessary and appropriate number of members for making effective decisions and securing substantial discussions. Although there are no female directors as of the date of submission of this report, we will make efforts to appoint female directors from the viewpoint of securing diversity in gender and internationality, and expertness.
(Article 6 of ITO EN’s Guidelines (Composition of the Board of Directors))
<Disclosure Based on the Principles of the Corporate Governance Code (Excerpts)>
【Principle 3-1 Enrichment of Information Disclosure】
Please see “1. Basic Policy” above and Article 1 of ITO EN’s Guidelines (Corporate Philosophy and Basic Views on Corporate Governance).
(2) Business strategy and plan : Please visit the relevant pages on ITO EN’s website belo
Business Strategy : http://www.itoen.co.jp/finance_ir/growth/
Business Performance/Plan : http://www.itoen.co.jp/finance_ir/performance/
(3) Policy and procedure in determining the remuneration for senior management and directors by the board of directors
Remuneration for each director (excluding outside directors) is composed of fixed monthly remuneration and performance-based remuneration. Remuneration for outside directors consists only of fixed monthly remuneration. The fixed monthly remuneration is determined according to each director’s title within the remuneration range resolved at the general meeting of shareholders while respecting the discussion held by the Nomination and Remuneration Committee, with the business performance in the previous year and the rate of achieving the forecast for the relevant year being taken into account. The performance-based remuneration is decided through the program of the stock acquisition rights as performance-based remuneration while the share acquisition right given to each director in charge is determined through thorough evaluation of business results. Remuneration paid to individual directors is determined based on the remuneration criteria resolved at the board of director’s meeting (Article 9 of ITO EN’s Guidelines (Policy and Procedure in Determining Remuneration for Directors)). Remuneration for the auditors is within the remuneration range resolved at the general meeting of shareholders and consists only of fixed monthly remuneration. It is decided through discussion among auditors at the board of auditors’ meeting (Article 10 of ITO EN’s Guidelines (Policy and Procedure in Determining Remuneration for Auditors)).
(4) Policy and procedure in appointing and dismissing senior management and nominating candidates for directors and auditors by the board of directors
Please refer to Article 7 (Policy and Procedure in Appointing Directors) and Article 8 (Policy and Procedure in Appointing Auditors) stipulated in ITO EN’s Guidelines.
This report is intended solely for information purposes, and is not intended as a solicitation to invest in the shares of this company. The information and opinions contained within this report are based on data made publicly available by the Company, and comes from sources that we judge to be reliable. However, we cannot guarantee the accuracy or completeness of the data. This report is not a guarantee of the accuracy, completeness or validity of said information and or opinions, nor do we bear any responsibility for the same. All rights pertaining to this report belong to Investment Bridge Co., Ltd., which may change the contents thereof at any time without prior notice. All investment decisions are the responsibility of the individual and should be made only after proper consideration. Copyright(C) 2019 Investment Bridge Co., Ltd. All Rights Reserved. |
For back numbers of Bridge Reports on ITO EN, LTD. (2593) and Bridge Salon (IR seminar), please go to our website at the following URL. www.bridge-salon.jp/