Bridge Report: (4767) TOW
![]()
 Koji Egusa, President & CEO | TOW Co., Ltd. (4767) |
 |
Company Information
Market | TSE 1st Section |
Industry | Service |
President | Koji Egusa |
HQ Address | Tokyo, Minato-ku, Toranomon 4-3-13, Hulic Kamiyacho Building |
Year-end | June |
Homepage |
Stock Information
Share Price | Number of shares issued(excluding treasury shares) | Total market cap | ROE (Actual) | Trading Unit | |
¥805 | 22,468,422 shares | ¥18,087 | 14.4% | 100 shares | |
DPS (Est.) | Dividend yield (Est.) | EPS (Est.) | PER (Est.) | BPS (Actual) | PBR (Actual) |
¥26.00 | 3.2% | ¥50.28 | 16.0 x | ¥402.75 | 2.0 x |
* Share price as of close on February 26, 2019. Shares outstanding as of the most recent quarter excluding treasury shares. Figures are rounded.
Consolidated Earnings
Fiscal Year | Sales | Operating Profit | Ordinary Profit | Net Profit | EPS (¥) | DPS (¥) |
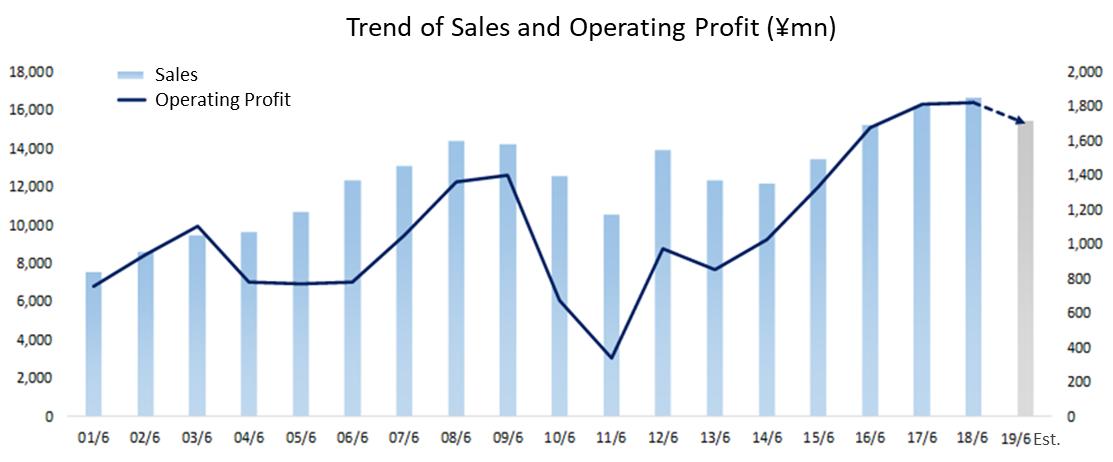
June 2014 | 12,188 | 1,026 | 1,035 | 638 | 28.90 | 28.00 |
June 2015 | 13,442 | 1,335 | 1,349 | 818 | 36.93 | 33.00 |
June 2016 | 15,230 | 1,678 | 1,682 | 1,083 | 48.35 | 22.00 |
June 2017 | 16,251 | 1,811 | 1,823 | 1,206 | 53.74 | 26.00 |
June 2018 | 16,688 | 1,825 | 1,873 | 1,207 | 53.75 | 27.00 |
June 2019 (Est.) | 15,436 | 1,700 | 1,714 | 1,129 | 50.28 | 26.00 |
* Unit: ¥mn
* Estimates are those of the Company. Effective from fiscal year March 2016, the definition for net income has been changed to net income attributable to parent company shareholders (Abbreviated hereafter as parent net income).
We present this Bridge Report reviewing the first half of fiscal year June 2019 earnings results and fiscal year June 2019 earnings estimates for TOW.
Table of Contents
Key Points
1.Company Overview
2.Medium Term Business Plan
3. First Half of Fiscal Year June 2018 Earnings Results
4. Fiscal Year June 2019 Earnings Estimates
5. Conclusions
<Reference: Regarding corporate governance>
Key Points
- In the first half of FY June 2019, sales decreased 4.3% year on year and ordinary income increased 12.9% year on year. Continuing from the previous term, the company is striving to achieve “Experience design* production.” The efforts have met with some success, including steady growth in orders and acquisition of large-scale projects. As for profit, the operating profit margin improved from 12.0% from the same period last year to 14.1% as a result of company-wide promotion of “securing appropriate profit by making high value-added proposals,” “extensive cost control” and “strict control of SG&A expenses.” Both sales and profits greatly exceeded the company’s initial forecast.
- There are no revisions to the full-year forecast, and the company expects sales and ordinary income to decline by 7.5% and 8.5%, respectively, year on year. Although there is a possibility of exceeding the forecasts, the company did not change the estimates due to uncertainties in the recovery of the real economy and the demand for advertising by clients. Backlog orders in the second half are low compared to the same period last year, but the company plans to increase the pace of orders in the second half. The dividend is expected to be 26.0 yen (including 13.0 yen in the first half).
- Although the full-year forecast was unchanged, the progress rate in the first half against the full-year forecast is 56.0% in sales and 71.9% in ordinary income. They are higher than the previous year’s actual results of 54.1% and 58.2%, respectively. Especially the progress rate of ordinary income this year is significantly high. It can be said that the company’s forecast is conservative. Also, in addition to the Rugby World Cup, orders for 2020 projects will be more specific and increase. Backed by the decision for the Osaka Expo and detailed management in terms of profit, the company gives an impression that it will maintain good performance for a while.
*It is to design a system in which, starting with “Wow!” type of interactions with “Experience design” brands, people become fans of the brand and maximize the spread and sharing of the experience using various media, especially SNS.
1. Company Overview
TOW Co., Ltd. is the top ranked independent company in the sales events and promotions industry and a Tokyo First Section publicly traded company. TOW engages in event and promotion planning, creation and operations, in addition to goods and printed materials relating to sales promotions. TOW is aware of the growing influence of the Internet and is placing increased emphasis on utilizing their many years of experience in event planning and idea generation by utilizing digital technologies to create interactive promotions (IP). The Company name TOW is derived from the slogan “Top Of the World” based upon TOW’s corporate philosophy of “spreading smiles by creating the world’s most unique experiences”,
In addition to TOW, the Group also boasts of the one consolidated subsidiary at the end of the first half of FY 2019: T2C Co., Ltd., which conducts event creation, operation, production and visual contents creation.
*The company had 2 consolidated subsidiaries as of the end of FY June 2018, but Sport Is Good Co., Ltd. was resolved as of the end of November 2018. The impact of the resolution on the business performance is minor.
Moreover, “interactive promotions” use digital technologies and ideas to create impressive experiences that are turned into information to be proliferated and shared as part of overall promotions.
Business Description
Flow of Event Planning to Implementation
Demand for event related work appears as soon as promoters come up with an objective (Transmission of information to the promoter’s audience). TOW begins work on creating a plan as soon as they are briefed by the promoter about the objective. Thereafter, meetings are held at every step of the workflow process from proposal, basic plan, implementation plan, detailed plan, progress script, construction drawing, time schedule chart and document creation. TOW also creates stages and conducts rehearsals until the day of the actual event.
Scope of TOW’s Business
In the case of events, TOW receives orders that span the entire range of the workflow process from planning to the actual holding of the event, and performs “planning”, “production”, “operations”, and “staging” activities, in addition to conducting various onsite services during the time that the actual event is conducted. Specifically, these are tasks involved with lighting, sound, visual, stage creation, and model, companion and security guard casting. In addition, TOW provides services related to preparation, site disassembly and removal, and cleaning. TOW is responsible for acting as a total director to oversee the entire event process and outsources these various tasks to specialized service providers with a goal of ensuring that the objectives of the promoter are accurately implemented and conveyed to the audience. The consolidated subsidiary T2 Creative Co., Ltd. specializes in event “production” and “operations”, while Sports Is Good Co., Ltd. specializes in sporting event experience planning and production.
The main services of promotions include “planning”, “design”, and “production”, printing, premium goods and services, graphic design, executive operations, OOH (Out Of Home: Advertising in public transportation, outdoors), website production and other services are conducted, in addition to the service provided by TOW in its events business of total direction overseeing all aspects of promotions including direction, production and product delivery services.
2. Medium Term Business Plan
Medium Term Business Plan: Japan's First "Experience Design Production"
Experience design" encapsulates things such as the way people make purchases, the way things are made, the way things are sold and encompasses the entire brand experience. “Wow!” type of interactions with brands is the starting point for experiences, and these experiences allow brands to build fans. In particular, leveraging social network sites (SNS) as hubs allow for the maximum dispersion of experience information relating to promotions across diverse media. TOW seeks to produce the Japan's first "experience design" production, and conducts efforts to pursue business opportunities in upcoming 2020 global sporting events and through alliance strategies. Moreover, expanding scale (maintaining high profitability x increasing competitiveness) will be also pursued.
"Experience Design Production"
By leveraging and combining strengths such as “real promotion events”, TOW facilitates interactive promotion (IP) alliance unit and data usage, and pursues results for the next phase of growth. Specifically, TOW seeks to strengthen IP by combining "data driven PR promotions" with integrated promotion capabilities including “internet (SNS) promotions”, “interactive events utilizing AR, VR, apps and other digital technologies”, and “video production, promotions”.
Promote Efforts for Alliance Strategies
Investments and M&A activities with firms that have strengths in “real”, “digital”, “video”, “PR”, and “data” will be pursued to establish deeper alliance relationships. Alliance relationship partners include the content creation company Kayak Co.Ltd. and CR boutique One to Ten design Co., Ltd. in the "digital" realm, Taiyo Kikaku Co. Ltd. and Geek Pictures, Inc. in the "video" realm, and PR firm Material Co. Ltd. in the "PR" realm. With regard to the "data" realm, boom research was implemented, which enables trend analysis on social media, and allowed TOW to facilitate project and effectiveness validation through its ability to allow access from all staff computers.
Scale Expansion
In order to expand the scale of the business, TOW has been increasing and incorporating a young team by hiring new graduates. 11 hires were made in April 2014, 15 in April 2015, 17 in April 2016, 20 in April 2017. The TOW Group has grown from 169 employees at the end of fiscal year June 2016 (TOW: 133, T2C 36) to 188 employees (TOW: 138, T2C 50) at the end of fiscal year June 2017, and 210 employees at the end of fiscal year June 2018.
TOW is endeavoring to increase competitiveness by maintaining high profitability for fiscal year June 2019 and beyond.
Medium Term Strategy Review and Countermeasures
① Responses to organizational reforms by some large clients
・The company assigned “Managing Director and Corporate Officer in Charge of Sales Management” as of January 1.
It launched an executive officer system to control company-wide sales.
・Transfer of employees within the head office has also been implemented.
It will carry out optimal resource distribution across the company.
・The company will strive to homogenize knowledge of sales management and promote measures to improve capacities to receive orders and develop proposals from a medium-term perspective
② Maintain High Profitability x Fortify Business Strategy and Personnel = Business Scale Expansion
・Operating margin: 12.0% (first half of FY June 2018) →14.1% (first half of FY June 2019), up 2.1 points.
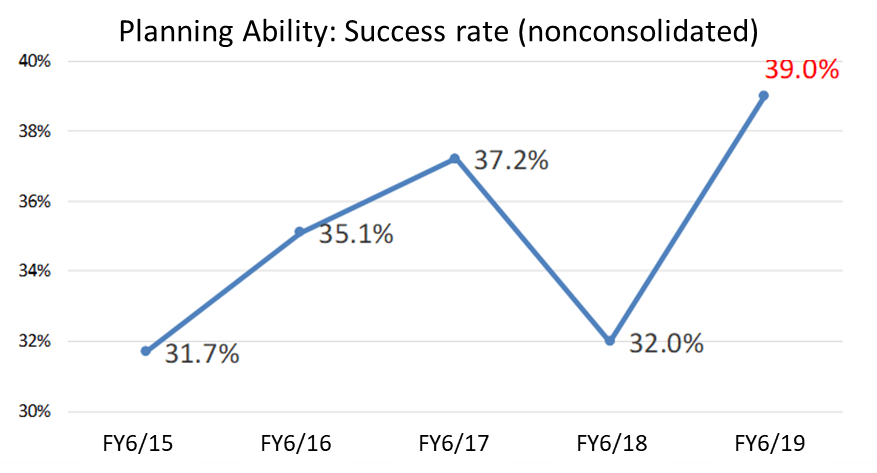
・Proposal success rates: 32%→39%, up 7 points.
・Number of employees within Group companies
169 (beginning of FY June 2017) ⇒188 (beginning of FY June 2018)⇒200(beginning of FY June 2019)
*High retention of employees is important.
③ Strengthen the position of TOW as Japan’s first “Experience Design Production”
・The company is in the process of improving employees’ experience design capabilities (from bilingual to multilingual).
⇒ The company is continuously implementing various measures to improve employees’ experience design capabilities including training, study groups, regular project reviews, collaboration with mid-career employees from different industries, internal commendation of training participants, evaluation system, and overseas study visit.
・Customers are also valuing the company’s experience design capabilities.
⇒ Medium- and large-scale projects incorporating experience design are also increasing.
・In the future, it will make company-wide efforts to further improve and deepen design capabilities including data utilization and alliance strengthening.
Increasing number of advertiser’s value “non-mass field.”
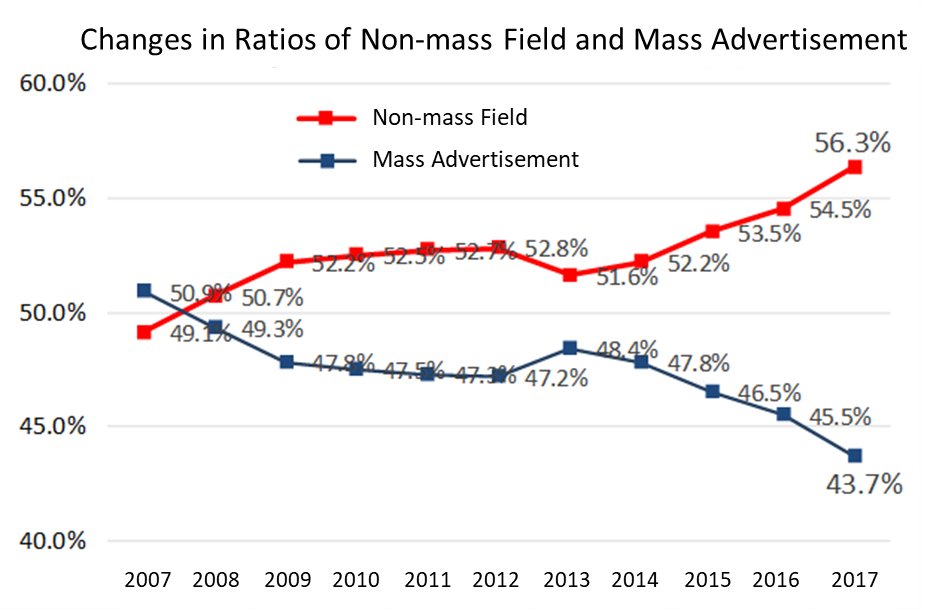
People are not moved just by mass-media advertisement.
The company designs experiences and moves people and hearts.
The company intends to develop a data utilization menu tailored to the issues of each project and pursue the accuracy and results of experience design.

Fifth Experience Design Award
This is an internal award held twice a year that encourages all employees to understand and challenge experience design and create better experience design projects.
④ Six years from 2019 to 2025 are the Golden International Event Years, including 2020 projects.
Many international big events where people from all over the world come together will be held for the coming six years, including G20 Osaka Summit, Rugby World Cup (2019), World Masters Games (2021), and Osaka Expo (2025). Promotion efforts of various companies are also expected to be active.
Under these circumstances, to acquire 2020 projects, the company will continuously aim for ensuring to receive orders for specific projects that have started.
⑤ Further Fortify Business Alliance Strategy
・In preparation for entering into the “Golden International Event Years,” the company has alliances with several event companies to handle orders for large-scale long-term projects.
・It will continue to work with event related companies across Japan.

3. First Half of Fiscal Year June 2018 Earnings Results
3-1 Consolidated Earnings
| 1H FY Jun. 18 | Ratio to Sales | 1H FY Jun. 19 | Ratio to Sales | YoY | Forecast | Compared with the initial forecasts |
Sales | 9,036 | 100.0% | 8,647 | 100.0% | -4.3% | 7,976 | +8.4% |
Gross Profit | 1,508 | 16.7% | 1,615 | 18.7% | +7.1% | - | - |
SG&A | 424 | 4.7% | 398 | 4.6% | -6.1% | - | - |
Operating Profit | 1,083 | 12.0% | 1,216 | 14.1% | +12.3% | 903 | +34.7% |
Current Profit | 1,091 | 12.1% | 1,233 | 14.3% | +12.9% | 912 | +35.2% |
Net Profit | 722 | 8.0% | 826 | 9.6% | +14.4% | 603 | +37.1% |
*Units: ¥mn
* Figures include reference figures calculated by Investment Bridge Co., Ltd. and actual results may differ (applies to all tables in this report)
Sales decreased 4.3% year-on-year while ordinary income grew 12.9% year on year, significantly exceeding the company’s forecasts.
Sales decreased 4.3% year on year to 8,647 million yen and ordinary income increased 12.9% year on year to 1,233 million yen. Continuing from the previous fiscal year, in order to respond to the customers’ needs to shift from mass media advertising to comprehensive promotions (including digital realm), the company is aiming for “experience design production” that can be combined with new fields such as digital, movies, PR and data by leveraging its strength of “real promotion.” The efforts bore fruit and the number of orders increased steadily. Furthermore, the company received an order for a large-scale experience event by a major foreign-affiliated luxury goods manufacturer as well as acquired major projects including a large-scale anniversary event for a major home-appliance manufacture that had been proposed for some time. While sales of the company itself increased, external sales of its subsidiary T2 Creative Co., Ltd. decreased. As for profit, operating profit margin improved from 12.0% from the same period last year to 14.1% as a result of company-wide promotion of “securing appropriate profit by making high value-added proposals,” “extensive cost control” and “strict control of SG&A expenses.” Both sales and profits greatly exceeded the company’s initial forecast. Operating profit and ordinary profit marked record highs for the fourth consecutive terms, and the net income attributable to owners of the parent was the highest in six consecutive terms.
Non-consolidated Earnings
| 1H FY Jun. 18 | Ratio to Sales | 1H FY Jun. 19 | Ratio to Sales | YoY |
Sales | 6,928 | 100.0% | 7,064 | 100.0% | +2.0% |
Gross Profit | 992 | 14.3% | 1,158 | 16.4% | +16.7% |
Operating Profit | 590 | 8.5% | 785 | 11.1% | +33.0% |
Current Profit | 1,018 | 14.7% | 1,361 | 19.3% | +33.7% |
Net Profit | 822 | 11.9% | 1,106 | 15.7% | +34.6% |
*Units: ¥mn
Sales increased, and each profit increased by double digits. Compared with the initial forecast, sales were 11.7% higher, operating income was 66.3% higher, ordinary income was 30.7% higher, and net profit was 25.3% higher.
Sales by Category (Excluding Planning)
| 1H FY Jun. 18 | Composition Raito | 1H FY Jun. 19 | Composition Raito | YoY |
Sales Promotion | 5,507 | 61.2% | 3,447 | 40.0% | -37.4% |
Publicity | 2,597 | 28.9% | 4,069 | 47.3% | +56.7% |
Culture and Sports | 239 | 2.7% | 199 | 2.3% | -16.8% |
Exhibition | 0 | 0.0% | 0 | 0.0% | - |
Productions | 647 | 7.2% | 894 | 10.4% | +38.0% |
*Units: ¥mn
By category of sales, sales to “publicity” increased significantly due to large-scale orders such as “anniversary event” and “new product launch party,” and the sales ratio of this category grew. The decrease in “sales promotion” is not due to reduction in inquiries, but to effectively utilize limited human resources.
Sales by Industry (Excluding Planning)
| 1H FY Jun. 18 | Composition Raito | 1H FY Jun. 19 | Composition Raito | YoY |
Information, Communication | 2,284 | 25.4% | 2,364 | 27.5% | +3.5% |
Foods, Beverages and luxury goods | 949 | 10.6% | 1,265 | 14.7% | +33.2% |
Cosmetics, Toiletries and Sundries | 886 | 9.9% | 1,014 | 11.8% | +14.5% |
Automobiles | 2,391 | 26.6% | 1,681 | 19.5% | -29.7% |
Precision Instruments, Other Manufacturing | 253 | 2.8% | 395 | 4.6% | +56.3% |
Governments, Organizations | 506 | 5.6% | 545 | 6.3% | +7.6% |
Finance | 255 | 2.8% | 585 | 6.8% | +129.6% |
Wholesale, Retailing | 579 | 6.4% | 145 | 1.7% | -74.9% |
Others | 886 | 9.9% | 612 | 7.1% | +30.8% |
*Units: ¥mn
By industry category, sales to the information, communication industry stably occupies high share rate. Furthermore, during this first half, sales to the food, beverage and luxury goods industry made a leap, led by a large-scale experience event of the new brand with a foreign-affiliated luxury goods manufacturer. Sales of computer games led the precision instruments and other manufacturing industry, and sales of life insurance led the finance industry. For the automobiles industry, sales decreased in response to a large-scale test-ride event in the previous term. And in the wholesale and retailing industry, sales promotion by convenience stores decreased.
Orders Number by Sale (non-consolidated)
| 1H FY Jun. 18 | 1H FY Jun. 19 | increase/decrease |
<¥10.00mn | 441 | 449 | +8 |
¥10.00~20.00mn | 68 | 54 | -14 |
¥20.00~50.00mn | 54 | 57 | +3 |
¥50.00~100mn | 21 | 15 | -6 |
>¥100mn | 8 | 12 | +4 |
Total | 592 | 587 | -5 |
Average Price (¥ 10,000) | 1,162 | 1,197 | +34 |
The number of large-scale projects over 100 million yen increased from 8 to 12, and the project unit price increased.
The company has been able to maintain a success rate (Number of promotions produced divided by total number of projects planned) above its guideline of 30%. During this term, it went closer to 40%, indicating an improvement of its proposal capability.
Taken from the material of the company
3-2 Financial Condition & Cash Flow
| End of Jun. 18 | End of Dec. 18 |
| End of Jun. 18 | End of Dec. 18 |
Cash, Equivalents | 4,098 | 3,867 | Accounts Payable | 1,868 | 1,988 |
Accounts Receivable | 5,673 | 6,285 | Short Term Debt | 840 | 840 |
Uncompleted Work Payments | 245 | 290 | Taxes Payable | 369 | 269 |
Uncollected Payments | 1,178 | 1,138 | Retirement Benefits for Directors | 404 | 396 |
Prepaid Expenses | 31 | 35 | Liabilities | 4,164 | 3,935 |
Current Assets | 11,265 | 11,643 | Net Assets | 8,832 | 9,149 |
Investments, Other | 1,625 | 1,339 | Total Liabilities, Net Assets | 12,996 | 13,084 |
Noncurrent Assets | 1,730 | 1,441 | Interest bearing liabilities | 840 | 840 |
*Units: ¥mn
*Accounts Receivable: Uncollected Sales/Loans transferred using the factoring methods
Total assets as of the end of the first half rose by 88 million yen from the end of the previous term (hereinafter the same) to 13,084 million yen.
Current assets rose by 377 million yen to 11,643 million yen. This is mainly due to an increase in notes and accounts receivables of 603 million yen, despite a decrease in cash equivalents of 231 million yen.
Noncurrent assets also dropped by 289 million yen to 1,441 million yen. This is mainly due to a decrease in investment securities of 278 million yen.
Current liabilities declined by 181 million yen to 3,520 million yen. This is due in part to recording of electrically recorded obligations of 66 million yen, an increase of accounts payable of 53 million yen, recording of taxes payable of 99 million yen, and a decrease in others of 220 million yen.
Noncurrent liabilities dropped by 46 million yen to 414 million yen, mainly due to a decrease in deferred tax liabilities of 42 million yen.
Net assets rose by 317 million yen to 9,149 million yen primarily due to an increase in retained earnings of 512 million yen.
Cash Flow Statement
| 1H FY Jun. 18 | 1H FY Jun. 19 | YoY | |
Operating CF (A) | 424 | 105 | -318 | -75.0% |
Investment CF (B) | -27 | -22 | +5 | - |
Free CF (A+B) | 396 | 83 | -313 | -79.0% |
Financing CF | -292 | -315 | -22 | - |
Cash, Equivalents at the end of term | 3,600 | 3,867 | +266 | +7.4% |
*Units: ¥mn
The balance of cash and cash equivalents at the end of the first half was 3,867 million yen, an increase of 266 million yen from the end of the first half of previous year.
A net inflow of cash of 105 million yen was recorded in operating CF (it was a net inflow of 424 million yen in the same period last year). The main factors contributing to the expansion in the net inflow are an increase in accounts receivables of 611 million yen, tax payments of 457 million yen, and pretax quarterly net profit of 1,233 million yen.
The net cash outflow of investing CF was 22 million yen (it was a net outflow of 27 million yen in the same period last year). The main factors contributing to this outflow include purchase of property, plant and equipment of 15 million yen and purchase of investment securities of 9 million yen.
Consequently, free cash flow decreased by 313 million yen year-on-year to 83 million yen.
A net outflow of 315 million yen was recorded in financing CF (it was a net outflow of 292 million yen in the same period last year). Factors behind this net outflow included the payment of dividends amounting to 314 million yen.
4. Fiscal Year June 2019 Earnings Forecasts
4-1 Consolidated Earnings
| FY Jun. 18 Act. | Ratio to Sales | FY Jun. 19 Est. | Ratio to Sales | YoY |
Sales | 16,888 | 100.0% | 15,436 | 100.0% | -7.5% |
Gross Profit | 2,691 | 16.1% | 2,519 | 16.3% | -6.4% |
Operating Profit | 1,825 | 10.9% | 1,700 | 11.0% | -6.8% |
Current Profit | 1,873 | 11.2% | 1,714 | 11.1% | -8.5% |
Net Profit | 1,207 | 7.2% | 1,129 | 7.3% | -6.5% |
*Units: ¥mn
Sales, Current Profit Expected to Decline by 7.5%, 8.5% year on year
There is no change in the full-year forecast, and the company estimates that net sales for FY June 2019 will drop 7.5% year on year to 15,436 million yen and ordinary profit will decrease 8.5% year on year to 1,714 million yen. Although there is a possibility that the results will exceed the initial forecast, the company decided not to change the forecast due to uncertainties in the recovery of the real economy and demand for advertising by clients.
The order backlog is as follows. Order backlog in the second half decreased from the same period last year, but the company plans to increase the pace of receiving orders in the second half.
Order Backlog (non-consolidated)
| FY Jun. 18 | FY Jun. 19 |
Sales | 6,928 | 7,064 |
Order Backlog (Total of A, B, i) | 4,137 | 3,649 |
Orders・Production during terms (Total of A, B, i) | 2,038 | 2,014 |
Total of ii and iii | 12,897 | 11,925 |
*Units: ¥mn
*FY June 18: as of February 8, 2018 FY June 19: as of February 7,2019
A: Events whose scale (Value amount) and implementation dates have been determined
B: Event orders have been determined, but their scale and implementation date have yet to be determined
i: Projects for which TOW expects to book orders with a high rate of confidence (Over 80%probability)
ii: Plans, project proposals for which TOW expects to book orders with a medium rate of confidence (Over 50% probability)
iii: Plans, projects proposal for which TOW has an uncertain level of confidence to book
4-2 Dividends
TOW uses dividend payout ratio and dividend yield on a consolidated basis as two fundamental indicators to determine profit distribution.
TOW uses dividend payout ratio and dividend yield on a consolidated basis as two fundamental indicators to determine profit distribution. Furthermore, the Company uses a dividend payout ratio target of 40% based upon consolidated earnings for the coming year and a dividend yield target of 4.5% based upon the closing share price on the day before the earnings announcement (2018/08/07), and selects the higher of the two indicators to determine its dividend payment. Based upon the fundamental policy for retained earnings, a maximum dividend payout ratio of 50% has been determined.
Using the above calculations, fiscal year June 2019 dividend per share is expected to be ¥25.14. Given this estimate, the expected dividend is ¥26, for a ¥1 decrease from the previous fiscal year, and ¥13 is expected to be paid at the end of first half.
5. Conclusions
Although sales decreased due to sluggish growth of the subsidiary, the profit margin improved significantly and profit increased sharply, and as a result, the results greatly exceeded the company’s forecast. Although the full-year forecast was unchanged, the progress rate against the full-year forecast for the first half is 56.0% in sales and 71.9% in ordinary income. They are higher than the previous year’s actual results of 54.1% and 58.2%, respectively. Especially the progress rate of ordinary income this year is significantly high. It can be said that the company’s forecast is conservative. Also, in addition to the Rugby World Cup, orders for 2020 projects will be more specific and increase. Backed by the decision for the Osaka Expo and detailed management in terms of profit, the company gives an impression that it will maintain good performance for a while.
Reference: Regarding corporate governance
◎ Organization type, and the composition of directors and auditors
Organization type | Company with audit and supervisory committee |
Directors | 9 directors, including 4 outside ones |
◎ Corporate Governance Report
Updated on October 10, 2018
Basic Policy
Our company recognizes corporate governance as "building and operating a structure that achieves appropriate and efficient decision making and business execution by the management, prompt result reports to stakeholders, and soundness, fairness and high transparency of business administration in order to continuously improve the corporate value." In order to achieve sustainable growth and improve our medium and long-term corporate value while fulfilling our responsibility to shareholders, customers, employees and other stakeholders, our company will achieve effective corporate governance in accordance with the basic policy stated below.
1. Respect the rights of shareholders and ensure equality.
2. Consider the interests of stakeholders including shareholders and cooperate properly.
3. Disclose company information properly and ensure the transparency.
4. Improve the effectiveness of the supervisory function for business execution by the board of directors.
5. Have constructive dialogue with shareholders who have an investment policy that matches the interests of shareholders over the medium to long term.
<Reasons for Non-compliance with the Principles of the Corporate Governance Code (Excerpts)>
【Supplementary Principle 1-2-4 Electronic exercise of voting rights and the English translation of the notice of convocation】
We will consider the introduction of a platform for electronically exercising voting right and the English translation of the notice of convocation in light of trends of ratios of institutional investors and foreign investors among the company’s shareholders.
【Supplementary Principle 3-1-2 Disclosure and provision of information in English】
We prepare an English version of business reports and also disclose analyst reports in English semi-annually on our website. In the future, we will consider provision of the materials for results briefing and contents of the convocation notice, etc. in English in light of trends of ratios of institutional investors and foreign investors among the company’s shareholders.
【Supplementary Principle 4-10-1 Involvement and advice of independent outside directors regarding nomination and compensation etc.】
In order to strengthen the independence, objectivity and accountability of the functions of the Board of Directors in relation to the nomination and compensation, etc. of directors etc., when examining the nomination and compensation etc., we will examine the development of a system aimed at implementing more fair and transparent examinations and procedures, including deeper collaboration with independent external directors.
<Disclosure Based on the Principles of the Corporate Governance Code (Excerpts)>
【Principle 1-4 Cross-holding shares】
The basic policy in making investments other than for pure investment purposes is to create synergy effects in the company’s integrated promotion business through business alliances and information sharing with companies that we invest in. In order to improve value in the medium- to long-term perspectives, we hold the minimum number of listed shares only when it is determined that holding the shares would be effective in consideration of strengthening relationships with business partners, etc.
With regard to the exercise of voting rights of cross-holding shares, in order to ensure appropriate responses, we examine each case from comprehensive viewpoints including the medium- to long-term improvement of the corporate value of the share issuing company as well as the medium- to long-term growth of economic benefits for us. For the major cross-holding shares, we will report the status of the exercise of voting rights to the Board of Directors.
【Principle 4-9 Independence Standards and Qualification for Independent External Directors】
We select external director candidates who meet the independence criteria set by the Tokyo Stock Exchange.
【Supplementary Principle 4-11-1 View on the balance, diversity and scale of knowledge, experience and capabilities as the entire Board of Directors】
The company stipulates the number of directors as 14 or less by the articles of incorporation, and as of October 1, 2018, the Board of Directors consists of 9 members (including 4 external directors). For the members of the Board of Directors, we take into consideration the diversity of experience, knowledge, capabilities, etc.
【Principle 5-1 Policy for having constructive dialogue with shareholders】
We are convinced that the most important mission to fulfill our company's responsibility is to promote two-way constructive dialogue with shareholders and investors, and to realize effective corporate governance in order to achieve sustainable growth and improve our medium and long-term corporate value.
Based on this idea, our company will implement the following measures.
1. Designation of directors in charge of dialogue with shareholders
In our company, executives have dialogue with shareholders, and the managing director controls IR activities.
2. Measures for organic coordination of in-company departments
In our company, the general affair team, which is also in charge of IR activities, discusses and exchanges opinions on a daily basis with the accounting team and they also collaborate in preparing the disclosed materials and discuss the content with executives.
3. Efforts for enhancing dialogue methods other than individual interviews
Our company will conduct the general shareholders' meeting that earns shareholders' trust by valuing the general shareholders' meeting as an opportunity for important dialogue with shareholders and ensuring sufficient information disclosure of our business. In addition, our company will work on achieving closer communication with shareholders and investors by regularly holding a financial results briefing.
4. Measures for feedback of opinions and concerns of shareholders
Our company will compile the opinions and concerns about our company heard in the dialogue with shareholders and investors at the department in charge and develop a system that reports this regularly to executives and the board of directors according to its importance and nature.
5. Measures for managing insider information
The basic policy of our company is to provide fair information disclosure in order to ensure substantive equality for shareholders and investors. Based on this policy, we will disclose important information about our company in a timely and fair manner, and strive to manage the information rigorously so that it will not be provided only to some shareholders and investors.
This report is intended solely for information purposes, and is not intended as a solicitation to invest in the shares of this company. The information and opinions contained within this report are based on data made publicly available by the Company, and comes from sources that we judge to be reliable. However, we cannot guarantee the accuracy or completeness of the data. This report is not a guarantee of the accuracy, completeness or validity of said information and or opinions, nor do we bear any responsibility for the same. All rights pertaining to this report belong to Investment Bridge Co., Ltd., which may change the contents thereof at any time without prior notice. All investment decisions are the responsibility of the individual and should be made only after proper consideration.
Copyright(C) 2019 Investment Bridge Co., Ltd. All Rights Reserved.